Knightswood
The profiles on these pages provide a comprehensive overview of health and wellbeing in Glasgow. There are 60 profiles in total, covering Glasgow as a whole, the three sub-sectors of the city (North East, North West and South Glasgow) and 56 neighbourhoods across the city. They highlight differences in health and life circumstances across the city for a range of indicators organised under broad themes: population; cultural factors; environment and transport; socioeconomic factors; education; poverty; and health. The profiles are intended to be a resource for local communities and to inform action at neighbourhood level.
Knightswood
A printer friendly version of this neighbourhood profile can be downloaded here.
Knightswood is a neighbourhood in the north west of Glasgow with a population of 17,525.
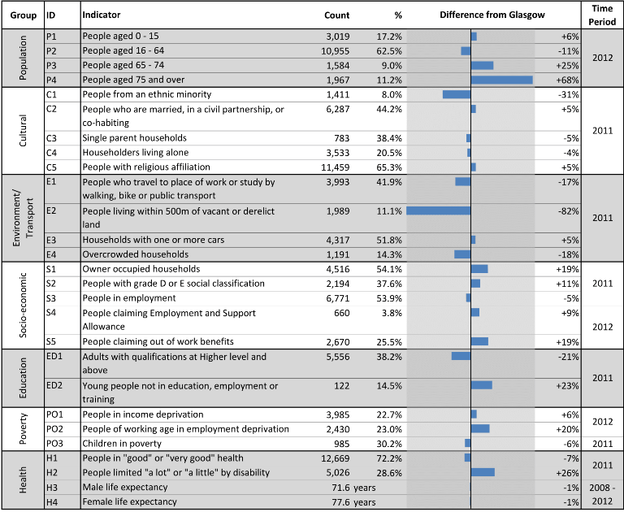
Neighbourhood comparisons with Glasgow
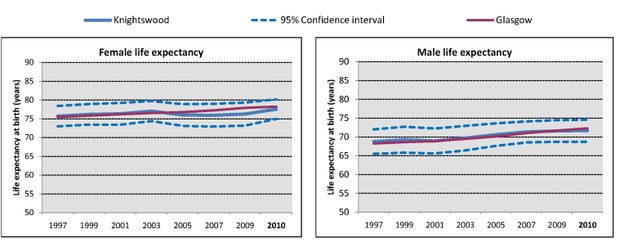
Women in Knightswood live, on average, six years longer than men. The estimates of life expectancy for males and females are very similar to the Glasgow average. The area has a relatively high percentage of older people - defined as aged 65 years and over. The majority of households in the area are owner occupied and only 11% of people live within 500 metres of vacant or derelict land. A relatively high percentage of young people are not in education, employment or training compared with the Glasgow average. Just under 30% of people are limited ‘a little’ or ‘a lot’ by a disability.

Life expectancy for both males and females has risen in recent years in Knightswood and has been similar to the Glasgow average throughout the period.

The population in Knightswood increased by 5% between 1996 and 2012, largely due to increases in the numbers of children and working age adults (aged 16-64). The number of older people in the area gradually decreased. The percentage of the total neighbourhood population from a minority ethnic group increased from 2% in 2001 to 8% in 2011, but remained considerably lower than the Glasgow average between 2001 and 2011.
Notes
A document giving detailed notes and definitions for the information presented in this profile can be downloaded here.
An Excel workbook containing the data used in all of the profiles can be downloaded here. This workbook also includes alternative output formats and further breakdowns of some of the variables.
1. Data sources: Scottish Index of Multiple Deprivation (SIMD) 2012, Census 2011, Census 2001, HMRC, NOMIS, National Records of Scotland (NRS) and Scottish Government.
2. Populations presented in the population trend chart and used to calculate life expectancy estimates are taken from NRS small area population estimates and are based on: the 2001 census for the years 1996 - 2001; both the 2001 and 2011 census for the years 2002 - 2010; and the 2011 census for the years 2011-2012.
3. The Income deprivation and Employment deprivation indicators are derived from SIMD 2012, more information on this deprivation index can be found at: http://simd.scotland.gov.uk/publication-2012
4. Life expectancies are calculated based on population estimates and death registrations. 95% confidence intervals have been added on the graphs to give an indication of their accuracy. The x-axes of the life expectancy graphs give the mid-year for each life expectancy estimate e.g. 2010 represents the life expectancy estimate for the period 2008 – 2012.
Glasgow City Council have also produced neighbourhood profiles based on data from the 2011 Census 2011 which can be accessed via this link.


