Primary
NB These statistics have not been updated since 2014.
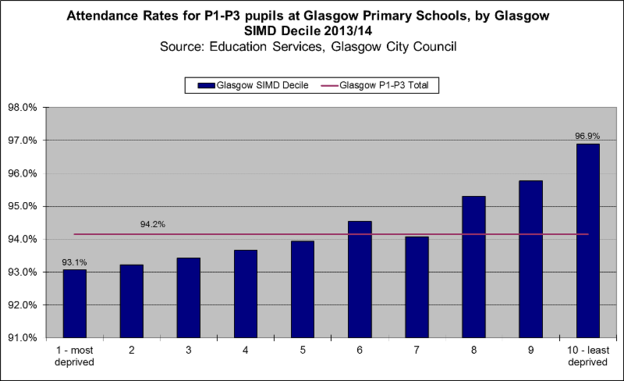
Attendance rates for P1-P3 pupils at Glasgow primary schools, by Glasgow SIMD decile, 2013/14
(click image to enlarge graph)
The attendance rate for P1-P3 pupils at Glasgow primary schools varies across the Glasgow SIMD deciles. The most deprived decile, decile 1 had the lowest attendance rate in 2013/14 for P1-P3 pupils (93.1%) and the least deprived decile, decile 10 had the highest attendance rate for this age group (96.9%).
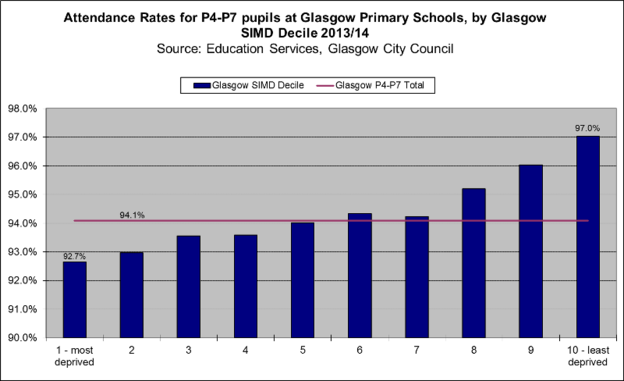
Attendance rates for P4-P7 pupils at Glasgow primary schools, by Glasgow SIMD decile, 2013/14
(click image to enlarge graph)
The attendance rate for P4-P7 pupils at Glasgow primary schools varies across the Glasgow SIMD deciles. The most deprived decile, decile 1 had the lowest attendance rate in 2013/14 for P4-P7 pupils (92.7%) and the least deprived decile, decile 10 had the highest attendance rate for this age group (97.0%).
Notes
Only data for pupils who attend a Glasgow school and who have a Glasgow address have been included in this. A proportion of Glasgow school pupils who live outwith the Glasgow city boundary have not been included. There are also a number of pupil addresses that were incomplete or inaccurate so were unable to be matched to a neighbourhood or SIMD decile.
SIMD – Scottish Index of Multiple Deprivation provides a relative measure of deprivation based on indicators from 7 domains – income, employment, health, education, access, housing, crime. The index identifies multiple deprivation for 6505 small areas (datazones) across Scotland. There have been four versions of SIMD to date. The initial index of 2004 (SIMD 2004) has been revised three times in 2006 (SIMD 2006), 2009 (SIMD 2009) and 2012 (SIMD 2012). For more information go to the SIMD site.
Deprivation deciles - the term ‘deprivation decile’ is used to represent 10% of a population with a particular level of deprivation. Thus, the most deprived decile equates to the most deprived 10% within a population, while the least deprived decile represents the 10% of a population living in the least deprived circumstances.
Additional Resources
-
ResourceThursday, 6 December 2012
Going to Gothenburg: Reflections on a Study Visit


