Deprivation
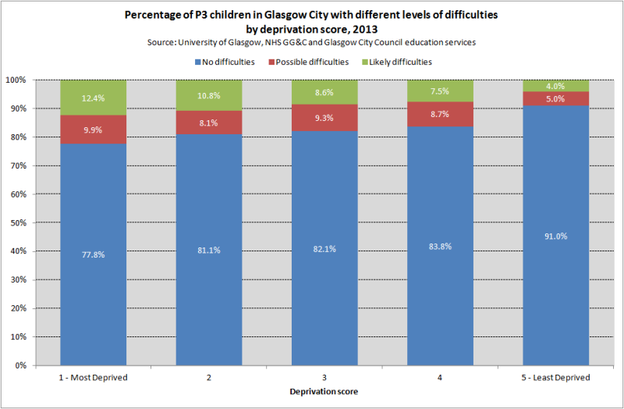
The proportion of children with possible and likely difficulties varied depending on the level of area deprivation in which the child lived. Children living in the highest levels of area deprivation had the highest proportions of difficulties: 9.9% having possible difficulties and 12.4% having likely difficulties, in contrast to children in the most affluent areas, 5% of whom had possible difficulties at P3 and 4% had likely difficulties.
Notes
SDQ - Goodman’ Strengths and Difficulties Questionnaire (SDQ) is a brief behavioural screening questionnaire for children. It covers five areas: Conduct Problems, Hyperactivity/inattention, Peer Relationship Problems, Emotional Symptoms and Pro-social Behaviours. The first four of these are rated negatively (that is, they pick up difficulties in children). These can be added together to give a Total Difficulties score, which shows an indication of overall difficulties that the child is experiencing. The final area, Pro-social Behaviours, is a positively scored scale, so it shows things the child does e.g. ‘is helpful if someone is hurt or upset’. The Total Difficulties score and the sub-scale scores can be split into groups which indicate whether a child has no difficulties, possible difficulties or likely difficulties.
This analysis reports on results from Primary 3 SDQs in the academic years 2011/12 and 2012/13 combined (data collected in February/March of each academic year). For more information on the study see About the Study.


