UK Cities
The Food Foundation and Sheffield University have produced estimated levels of food insecurity for cities and local authorities across the UK. These are based on linking survey data with predictor variables - more detail on the methods is available on their website.
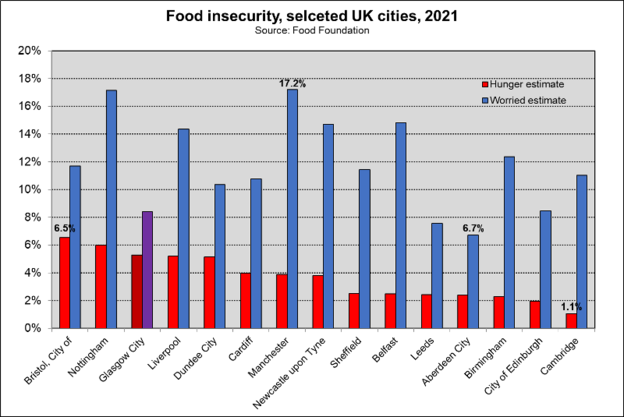
The two variables presented here are ‘hunger’ and ‘food worry’. Hunger refers to those answering positively to the question: “Have you/anyone else in your household ever been hungry but not eaten because you couldn't afford or get access to food over the past month?”. Worry includes anyone answering very or fairly worried to the question: “How worried, if at all, are you currently about getting the food you need?”.
Click on graph to expand
This chart shows the selected cities arranged from the highest to lowest estimates of hunger levels. These are highest in Bristol, where an estimated 6.5% of the population had experienced hunger due to a lack of access to food, and lowest in Cambridge (1.1%). Estimates about worry around food security ranged from 17.2% in Manchester to 6.7% in Aberdeen – and there did not seem to be a direct link between the two measures, suggesting there are different or various drivers of worry about food security and of hunger across these cities.
This page was updated in October 2022.
Additional Resources
-
ResourceWednesday, 2 June 2010
SIMD Analysis: Future Projections
An analysis of the reasons behind the recent decline of deprivation in Glasgow, with tend projections towards 2015. -
ResourceSunday, 1 November 2009
Miniature Glasgow - Video
An extension of the GCPH's work profiling Glasgow's health, produced in collaboration with the International Future Forum.


