Glasgow City Region
Small particulate matter (PM2.5 – atmospheric particulate matter with a diameter of less than 2.5 micrometers) is made up of fine particles that can be carried deep into the lungs, where they can cause inflammation and a worsening of the condition of people with heart and lung diseases. They may also carry harmful compounds, absorbed on their surfaces, into the lungs. Current evidence suggests that there is no safe level of particulate matter in terms of human health effects.
This page provides modelled estimates of mean concentrations of PM2.5 and mortality attributable to PM2.5 for local authorities in the Glasgow City Region.
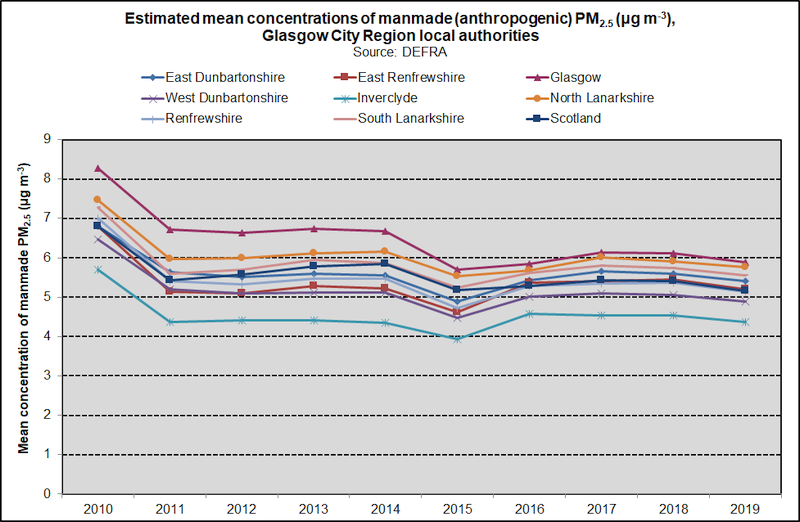
Estimated mean concentrations of manmade (anthropogenic) PM2.5 in the Glasgow City Region
 Glasgow had the highest mean concentration of PM2.5 in the Glasgow City Region in the period 2010-2019. Inverclyde had the lowest mean concentration of PM2.5. Overall, mean concentrations of PM2.5 have decreased across all local authorities since 2010, although all also exhibit a slight rise since 2015. Glasgow's average concentration was 8.3 μg/m3 in 2010; by 2019, this had declined to 6 μg/m3.
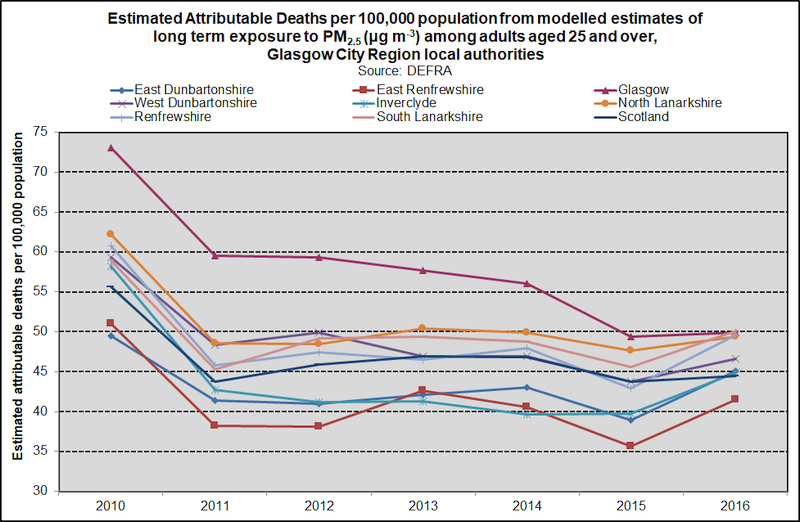
Particulate matter (PM2.5) estimated attributable deaths in Glasgow City Region
The evidence for the adverse effects of air pollution is strongest in relation to the impact of particulate matter, especially fine particulate matter (PM2.5). Exposure to PM2.5 is associated with an increased overall risk of death and shorter average life expectancy, especially for people with poor heart or lung health. Increasing evidence suggests that particulate matter, even at relatively low levels, may increase the risk of a range of other illnesses.
 The rate of estimated attributable deaths has declined in Glasgow from approximately 73 per 100,000 adults (aged 25 and over) in 2010 to 50 per 100,000 adults in 2016. Glasgow had the highest rate of mortality, albeit decreasing year-on-year, until 2016, when it was narrowly overtaken by South Lanarkshire. East Renfrewshire has consistently had the smallest proportion of deaths attributable to PM2.5.
Notes
1. These data are derived from the Air Pollution & Health Briefing Note (Mortality associated with exposure to fine particulate matter (PM2.5 attributable mortality) in Scotland) published by Health Protection Scotland in June 2018.
2. In 2016, Scotland opted to make its annual mean PM2.5 objective more stringent, by reducing it from 12 µg m-3 to 10 µg m-3 in line with the World Health Organization guideline.
3. The Scottish Government's air quality policy: Cleaner Air for Scotland 2 - Towards a Better Place for Everyone
