Greenhouse gas emissions
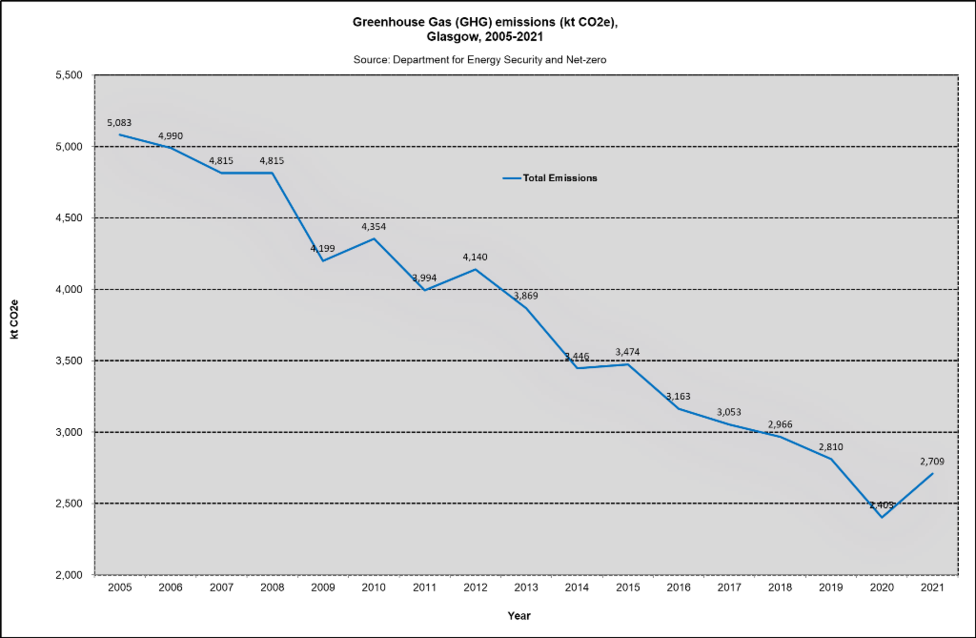
Greenhouse Gas (GHG) emissions, Glasgow, 2005-2021
Greenhouse Gas (GHG) emissions in Glasgow, measured as kilo tonnes of CO2 equivalent per year (ktCO2e/year), reduced by 47% between 2005 and 2021. There was a steep reduction in 2020, coinciding with the start of the COVID-19 pandemic and associated restrictions on work and movement. GHG emissions increased again in 2021 after the removal of most restrictions.
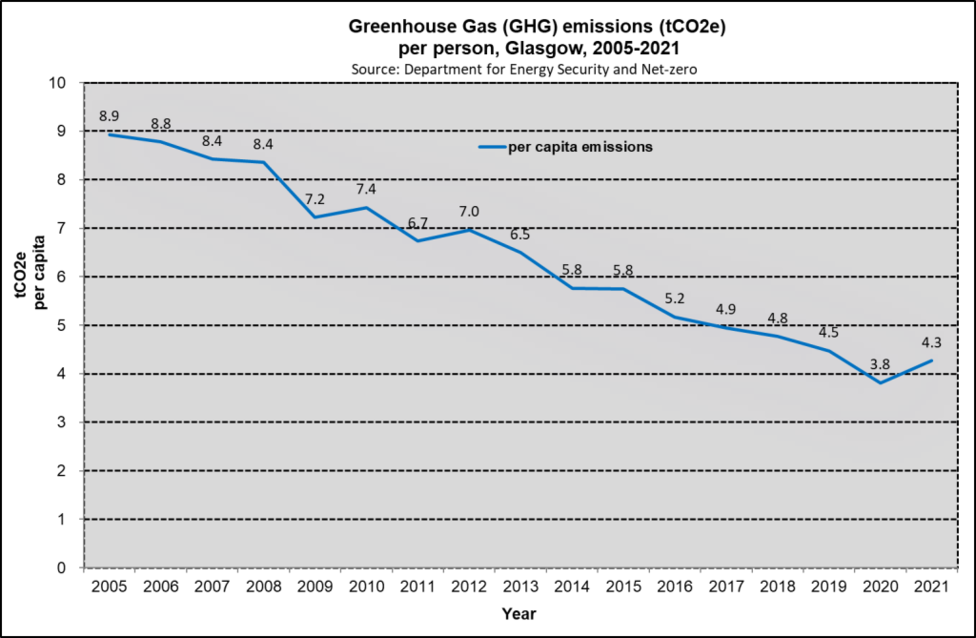
Greenhouse Gas (GHG) emissions per person, Glasgow, 2005-2021
GHG emissions per person in Glasgow reduced by 52% between 2005 and 2021. Based on this measure, in 2021, there were 4.3 tonnes of CO2 equivalent produced per person in Glasgow.
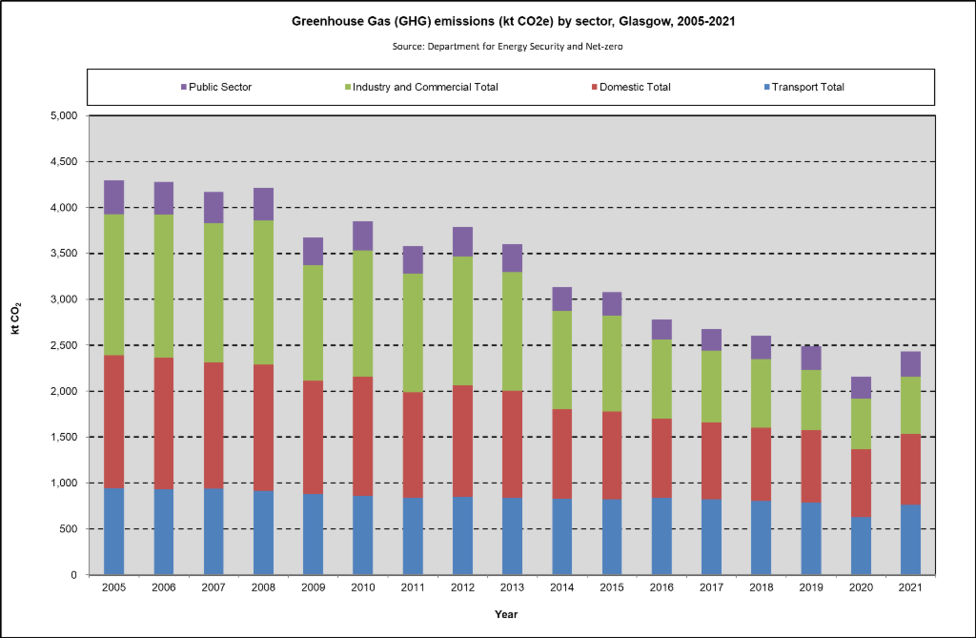
Greenhouse Gas (GHG) emissions by sector, Glasgow, 2005-2021 In the period 2005-2021, GHG emissions (measured as ktCO2e/year) from all sectors reduced in Glasgow, with the largest reduction being in industrial and commercial consumption (-59%), followed by the domestic sector (-47%). The lowest reduction was in the transport sector (-19%).
As GHG emissions have reduced, the contribution due to transport has risen because the fall in transport emissions has been relatively less than in the other sectors. In 2021, 29% of Glasgow's GHG emissions came from the domestic sector, 28% were from the transport sector, 23% from the industrial and commercial sector and 10% from the public sector.
Emissions from other sectors not shown on this chart, such as agriculture and waste management, account for less than 10% of emissions in the city.
Notes
The data presented come from the Department for Energy Security and Net-zero. The greenhouse gases covered by these statistics are carbon dioxide, methane, and nitrous oxide. In accordance with international reporting and carbon trading protocols, each of these gases is weighted by its global warming potential (GWP), so that total greenhouse gas emissions can be reported on a consistent basis (in carbon dioxide equivalent units).
Emissions are allocated on an “end-user” basis where emissions are distributed according to the point of energy consumption (or point of emission if not energy related). Except for the energy industry, emissions from the production of goods are assigned to where the production takes place. Therefore, emissions from the production of goods which are exported will be included, and emissions from the production of goods which are imported are excluded.
A consequence of this approach to calculating emissions – which is done to provide comparable statistics across local authorities – is that the figures for Glasgow do not take account of the carbon footprint of goods imported to and then bought or consumed in the city. The figures also do not take account of personal air travel.
This page was updated in July 2023.
