Energy consumption
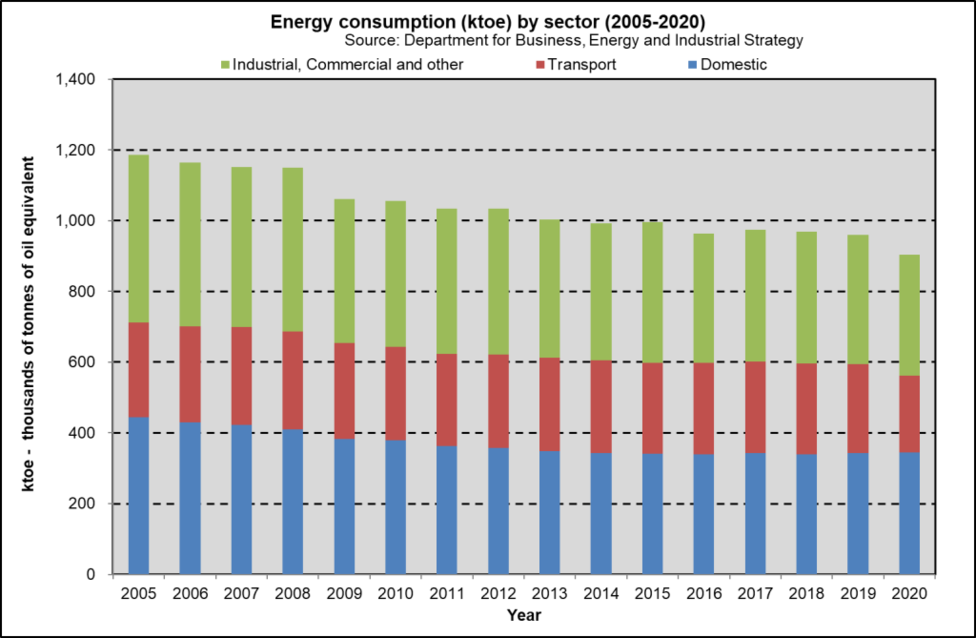
Energy consumption trends by sector, Glasgow Glasgow's energy consumption, measured in thousands of tonnes of oil equivalent (ktoe), reduced by 24% between 2005 and 2020, with the largest reductions being in domestic consumption (22%) and industrial and commercial consumption (28%). The lowest reduction (19%) was in transport energy use. In 2020, 38% of Glasgow's energy consumption was in the industrial and commercial sector, 38% was attributed to domestic consumption and 24% was in the transport sector. It is likely that the COVID-19 restrictions on work and travel reduced transport-related energy consumption and increased domestic energy consumption in 2020.
Notes
The data presented were sourced from the Department for Business, Energy & Industrial Strategy.
