Glasgow and Scotland
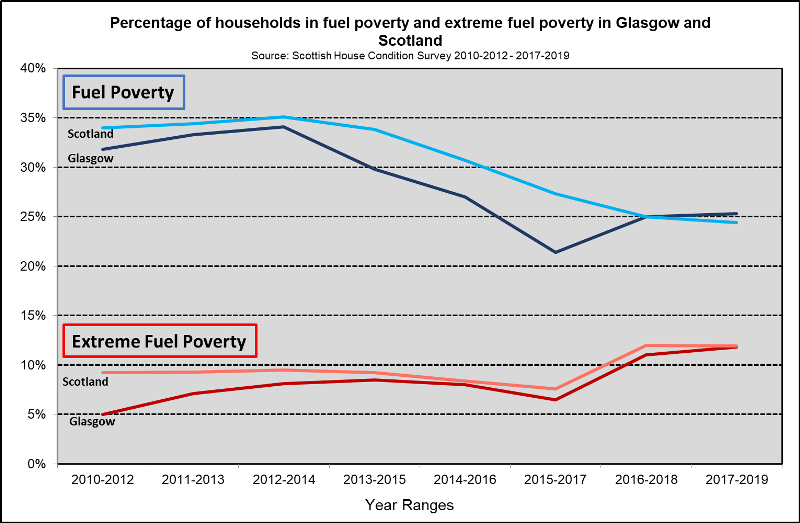
Fuel poverty and extreme fuel poverty in Glasgow and Scotland Households are in fuel poverty when they need to spend at least 10% of their income on fuel. Fuel poverty has improved both in Scotland and in Glasgow since 2010, despite rises between 2012 and 2014. Fuel poverty in Glasgow remained lower than the Scottish average until 2016-2018, when it rose to similar levels.
Households that need to spend over 20% of their income on fuel are in extreme poverty. Extreme fuel poverty in Scotland was 3% higher between 2017 and 2019 than it was between 2010 and 2012. Extreme fuel poverty in Glasgow also rose in the period 2010-2019, by around 7%. Both figures rose in the last two recorded measurements, between 2015-2017 and 2017-2019.
These figures are from 2017-2019, and there are not yet published figures which take into account the impacts of COVID-19 and the associated restrictions, or the rises in energy prices since the end of 2021.
Notes
A household in fuel poverty is one that needs to spend more than 10% of its income (including Housing Benefit or Income Support for Mortgage Interest) on all household fuel use in order to maintain a satisfactory heating regime. Extreme fuel poverty is defined as a household having to spend more than 20% of its income on fuel. The likelihood of a household experiencing fuel poverty is influenced by income, fuel costs and energy efficiency of the dwelling.
These figures were sourced from the Scottish Households Condition Survey, and do not take into account bill rebates received under the warm homes discount scheme, or income received by additional adults other than the highest income householder and their partner. Therefore, these figures are likely to overstate the number of fuel poor households to an extent.
