UK countries and cities
Mortality trends: UK countries and cities
This page presents a brief summary of findings from a study of UK mortality trends at a country and city level over a 40 year period. In the study, country comparisons were made between Scotland, England and Wales, and Northern Ireland, while for the cities, comparisons were made between the largest cities in each country (with the exception of London): Glasgow, Edinburgh, Dundee and Aberdeen in Scotland; Liverpool, Manchester, Birmingham, Leeds, Sheffield and Bristol in England; and Belfast in Northern Ireland.
Previously improving life expectancy and all-cause mortality in the UK has stalled since the early 2010s. National analyses have demonstrated changes in mortality rates for most age groups and causes of death, and with deprived populations most affected. This study aimed to establish whether similar changes have occurred across different parts of the UK.
In summary, the study showed stalling improvements in mortality from around 2011-2013 throughout the UK for all adult age groups, and for men and women. In the period 2015-17 there was also increased mortality among the most deprived populations in all countries and cities analysed, and for most causes of death. As a consequence, absolute and relative mortality inequalities increased.
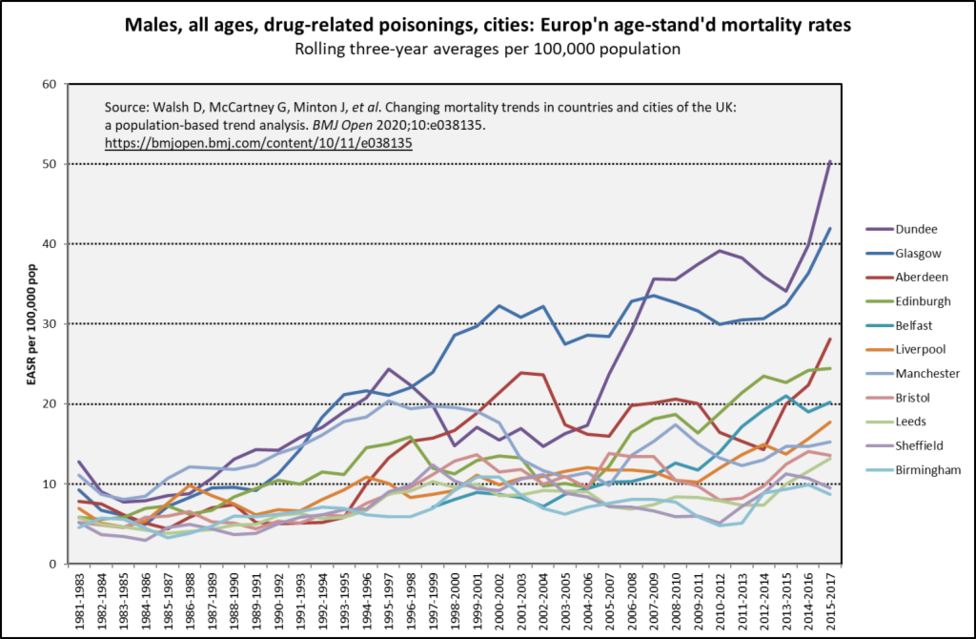
Particular issues were apparent in Scotland, for example higher and increasing drug-related mortality (with the highest rates observed in Dundee and Glasgow).
The timing, geography and socioeconomic gradients associated with these changes in mortality appear to support suggestions that they may result, at least in part, from UK Government ‘austerity’ measures, which have disproportionately affected the poorest.
The graphs below illustrate some of the city mortality trends from this study.
City mortality trends
Mortality rates fell across all the cities for most of the period between 1981-1983 and 2015-2017, but the rate of reduction slowed from around 2011-13. However, in the most recent five-year period, mortality rates actually worsened among both males and females in Dundee and Aberdeen, and among females in Manchester, while there was virtually no improvement in male mortality in Liverpool and female mortality in Birmingham.
The graph below illustrates the female all-cause mortality rate across the selected UK cities. Glasgow has had the highest mortality rate over the whole period, and there is clear evidence of the stalling reduction in female mortality in the period from 2010-12 onwards. 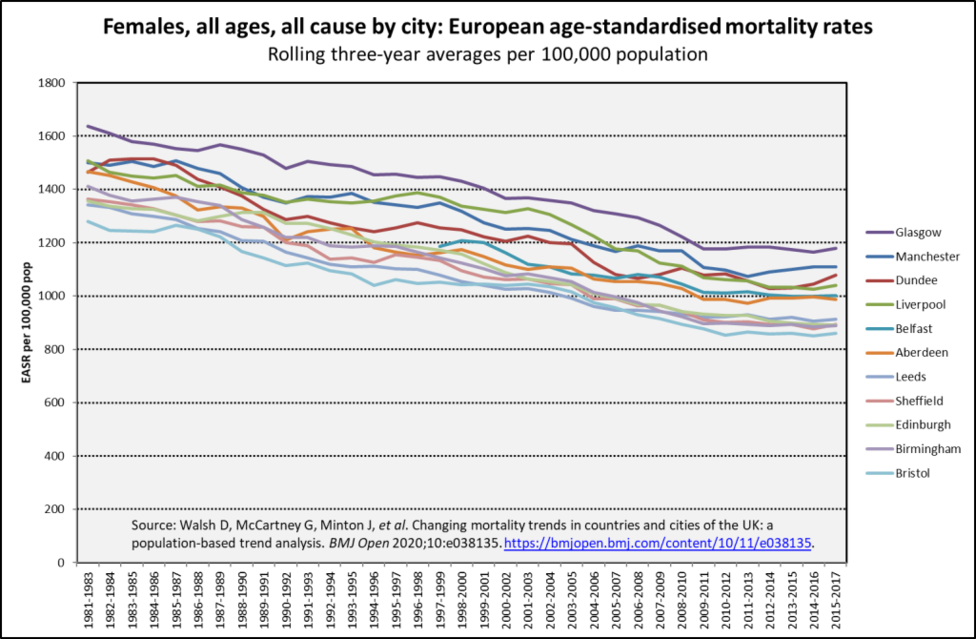 Similar trends are observed in male all-cause mortality rates (not shown), and again Glasgow stands out as having the highest male mortality rates among the cities compared over the whole period studied.
City mortality trends by deprivation
Increased mortality rates are observed in the most recent period for the most deprived fifth of the population in each country/city. The graphs below illustrate male all-cause mortality rates and the rates for the least and most deprived deprivation quintiles in two Scottish cities, Glasgow and Dundee,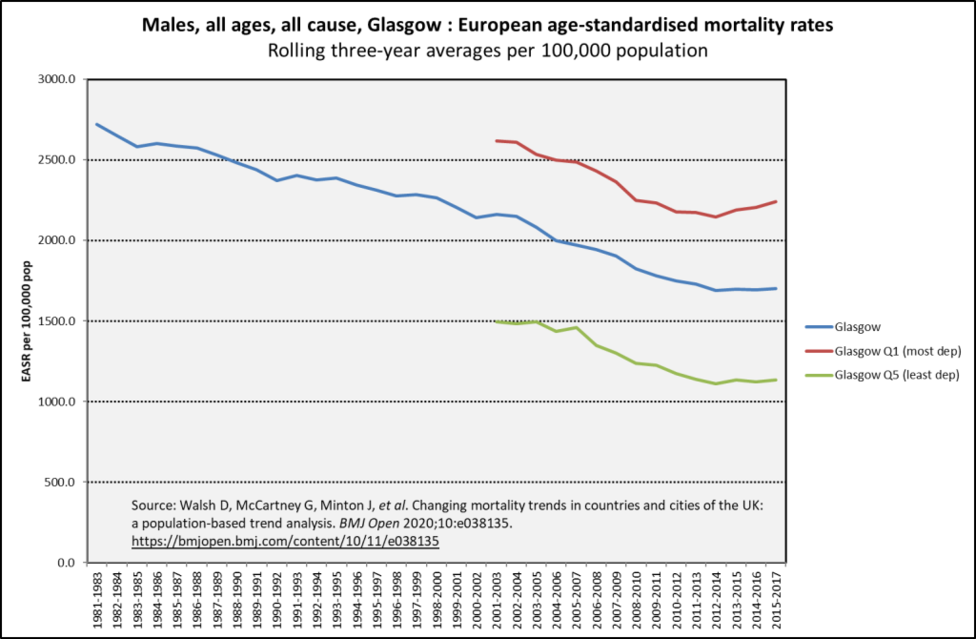
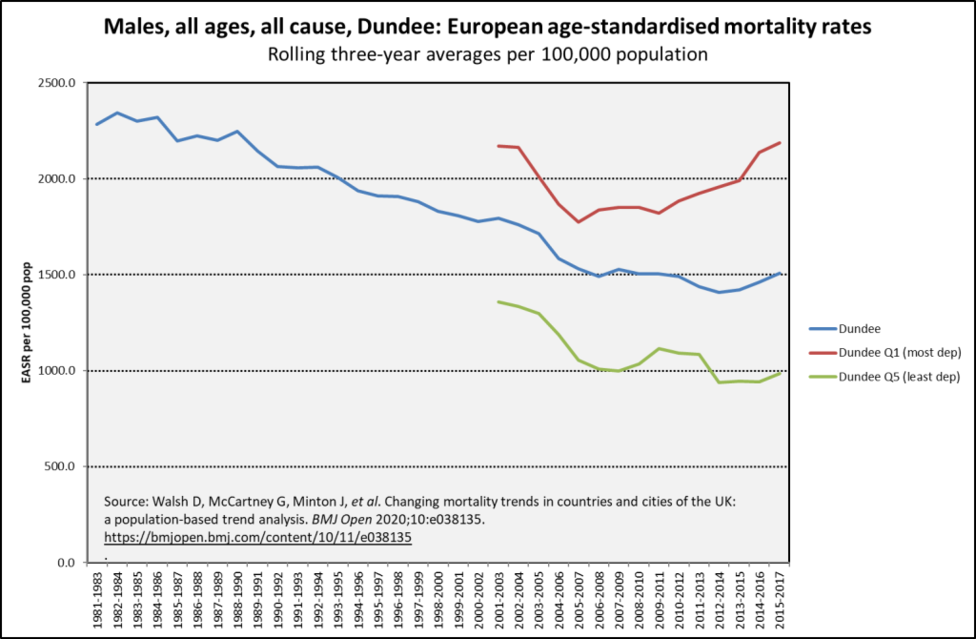 There is a clear increase in mortality in the most deprived quintile of each city in recent years, although this happened earlier in Dundee.
Similar female mortality trends were observed in each city, albeit with lower overall rates of mortality.
City mortality trends by cause
Glasgow stands out in terms of having the highest mortality rates of all the cities for all-causes and for the majority of individual causes analysed, including strikingly different trends for alcohol-related causes – see the trend for males below.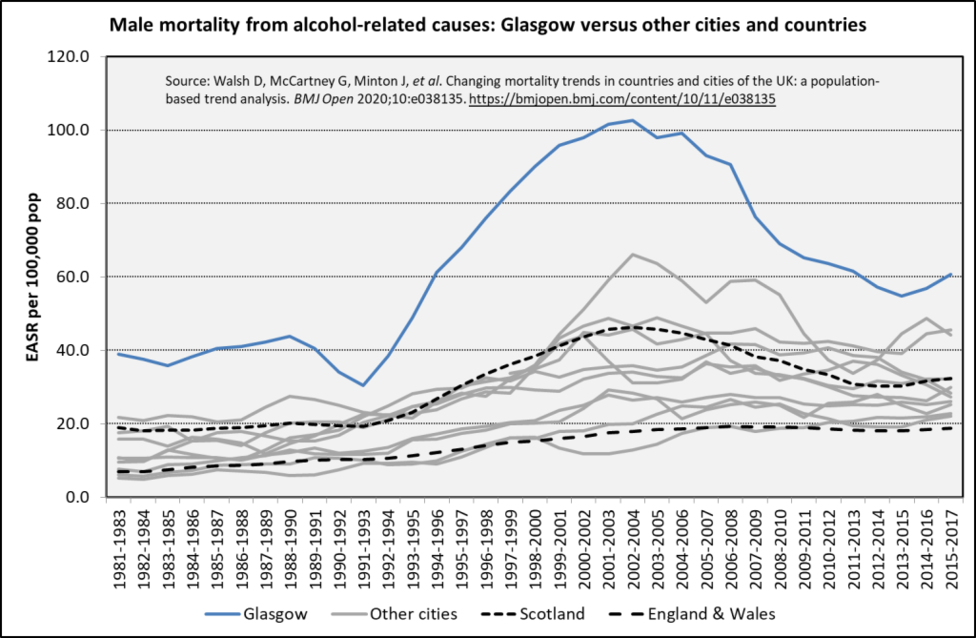 Some exceptions do apply, however: for example for all ages, death rates from IHD are now marginally higher in Manchester for both males and females, while male deaths from drug-related poisonings are now highest in Dundee – see below.
Notes
Further information on this study is available on the GCPH website and the published paper can be accessed via the link below.
Source: Walsh D, McCartney G, Minton J, et al. Changing mortality trends in countries and cities of the UK: a population-based trend analysis. BMJ Open 2020;10:e038135. https://bmjopen.bmj.com/content/10/11/e038135.

