Alcohol consumption (self reported) by deprivation
Comparisons of alcohol consumption by deprivation
Click on graph to expand
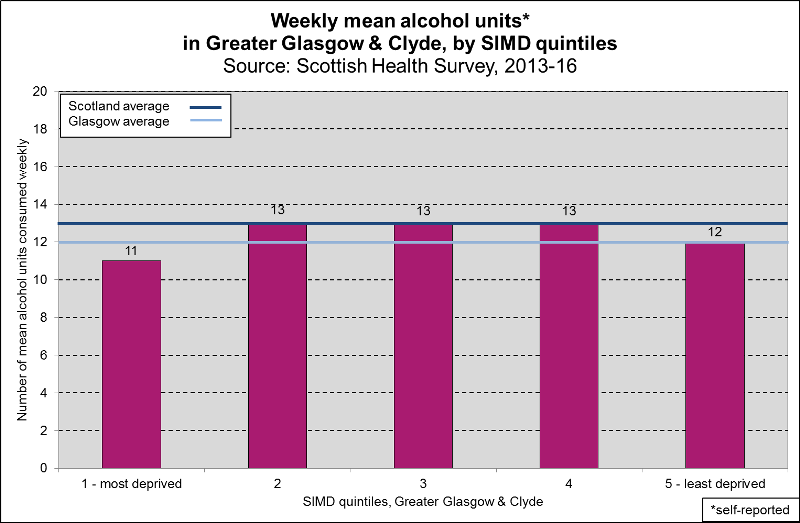
Across Greater Glasgow and Clyde, weekly mean unit consumption was lowest in the most deprived (11%) and least deprived (13%) areas, and was the same for the middle three quintiles.
Click on graph to expand
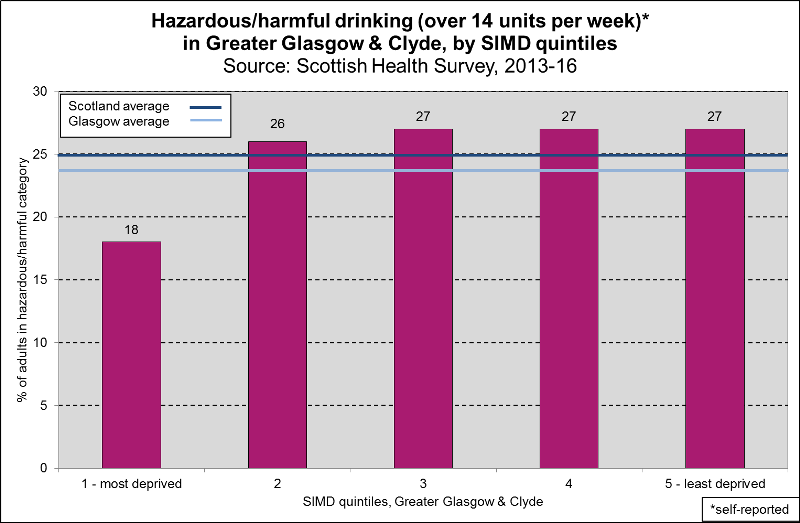
For harmful/hazardous drinking across Greater Glasgow and Clyde, this was highest in the least deprived quintiles, and lowest in the most deprived quintile.
However, these figures are from self-reported levels of alcohol consumption, which is known to be an underestimate of true alcohol consumption. Alcohol mortality data shows a different pattern, with higher alcohol-related deaths in more deprived areas.
Notes
Source: Scottish Health Survey 2013 to 2016
Additional Resources
-
ResourceWednesday, 11 June 2014
Exploring alcohol-related harm in Glasgow
A new report from the Glasgow Centre for Population Health explores the increasing burden of alcohol related deaths in Glasgow from a local, national and international context. -
ResourceThursday, 26 May 2011
Your Better Life Index
A new, interactive index allowing users to measure and compare their lives. -
ResourceSunday, 1 November 2009
Miniature Glasgow - Video
An extension of the GCPH's work profiling Glasgow's health, produced in collaboration with the International Future Forum. -
ResourceWednesday, 19 August 2009
A Games Legacy for Glasgow
Brochure outlining the potential legacy of Glasgow's role as Commonwealth Games host city in 2014. -
ResourceFriday, 17 July 2009
Views of Health in Glasgow - Video
Originally produced for an international audience at a conference in Pittsburgh, USA, this film provides insights on health concerns and beliefs drawn from interviews with Glaswegians themselves and with a group of health experts. -
ResourceMonday, 3 April 2006
Let Glasgow Flourish
A comprehensive report on health and its determinants in Glasgow and West Central Scotland