Walking
Pedestrian counts, Glasgow City Centre
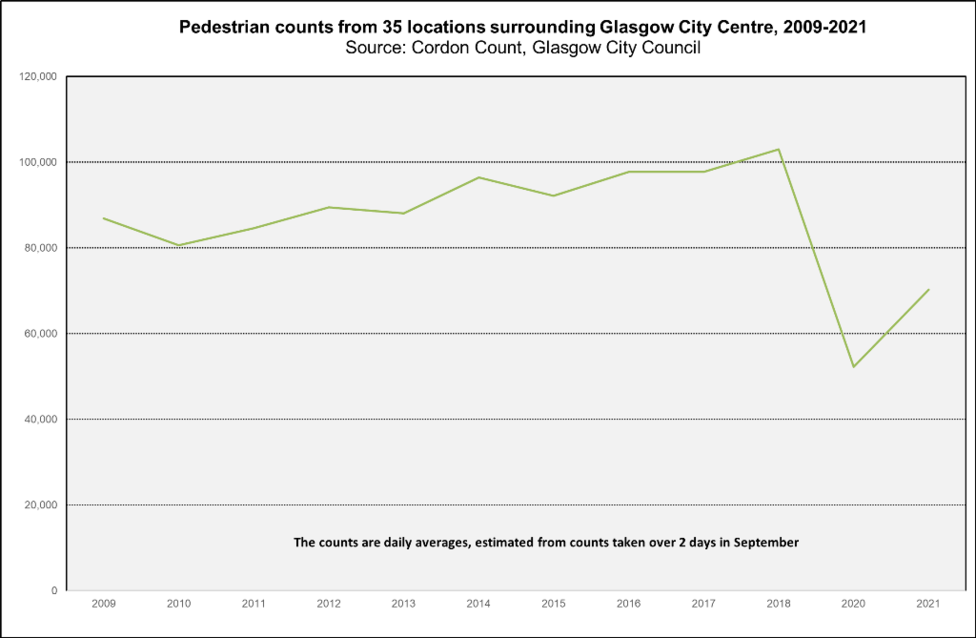
Over the last 12 years, Glasgow City Council has commissioned a count of cyclists and pedestrians entering and leaving the city centre. The graph below shows counts of pedestrians moving into and out of the city centre based on this two-day survey in the period 2009-2021. Pedestrian counts reduced by 19% comparing 2021 to 2009. However, the trend graph above illustrates a more nuanced pattern over the whole period and the impact of the pandemic. There was a steady overall rise in people walking in and out of the city centre up to 2018, equating to annual average growth of 2%. However, when the pandemic struck restrictions on work and travel led to a sharp decline in pedestrian journeys to and from the city; between 2018 and 2020 pedestrian counts almost halved, although there was a modest recovery in 2021.
Notes
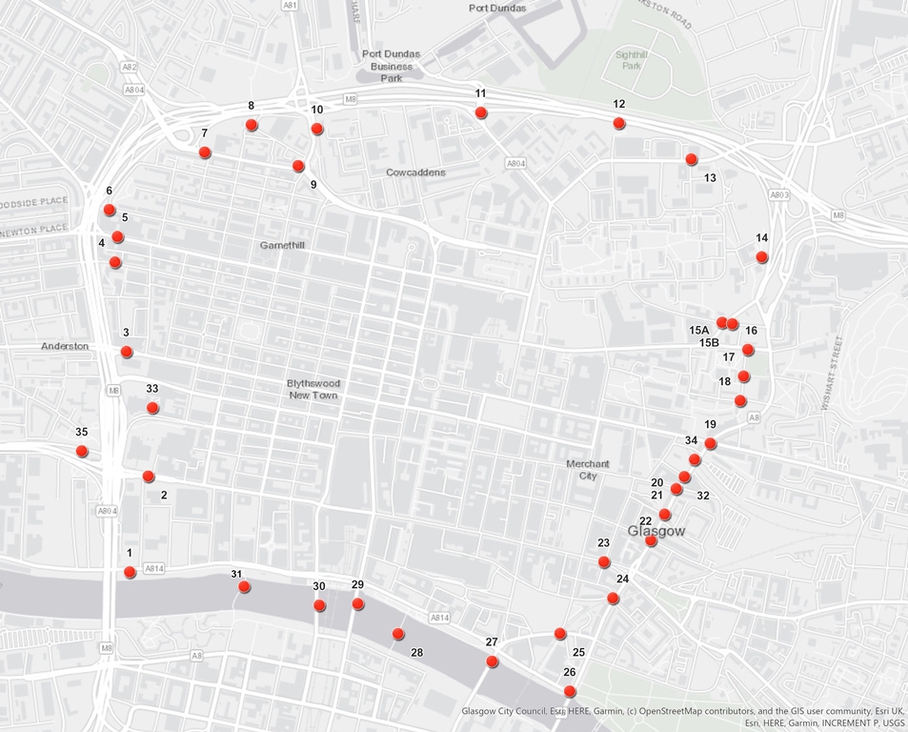
Glasgow City Council has undertaken annual surveys since 2007 to evaluate the number of pedestrians and cyclists entering and leaving the city as part of the annual monitoring of active travel patterns. A total of 35 sites form a cordon around the centre of the city and are monitored between 6:00am and 8:00pm over two successive days each September. All pedestrian and cycle movement at these locations, to and from the city, are counted.
A blog on the most recent cordon count trends can be accessed here.
Map of the cordon count recording sites Further reading:
Get Scotland Walking is a joint GPCH/Living Streets publication (September 2022) that summarises walking trends in Scotland, the health and societal benefits of walking, relevant policy, issues which discourage walking and the impacts of the COVID-19 pandemic on walking.


