Glasgow trends
Glasgow’s population by ethnic group, 2001, 2011 and 2022
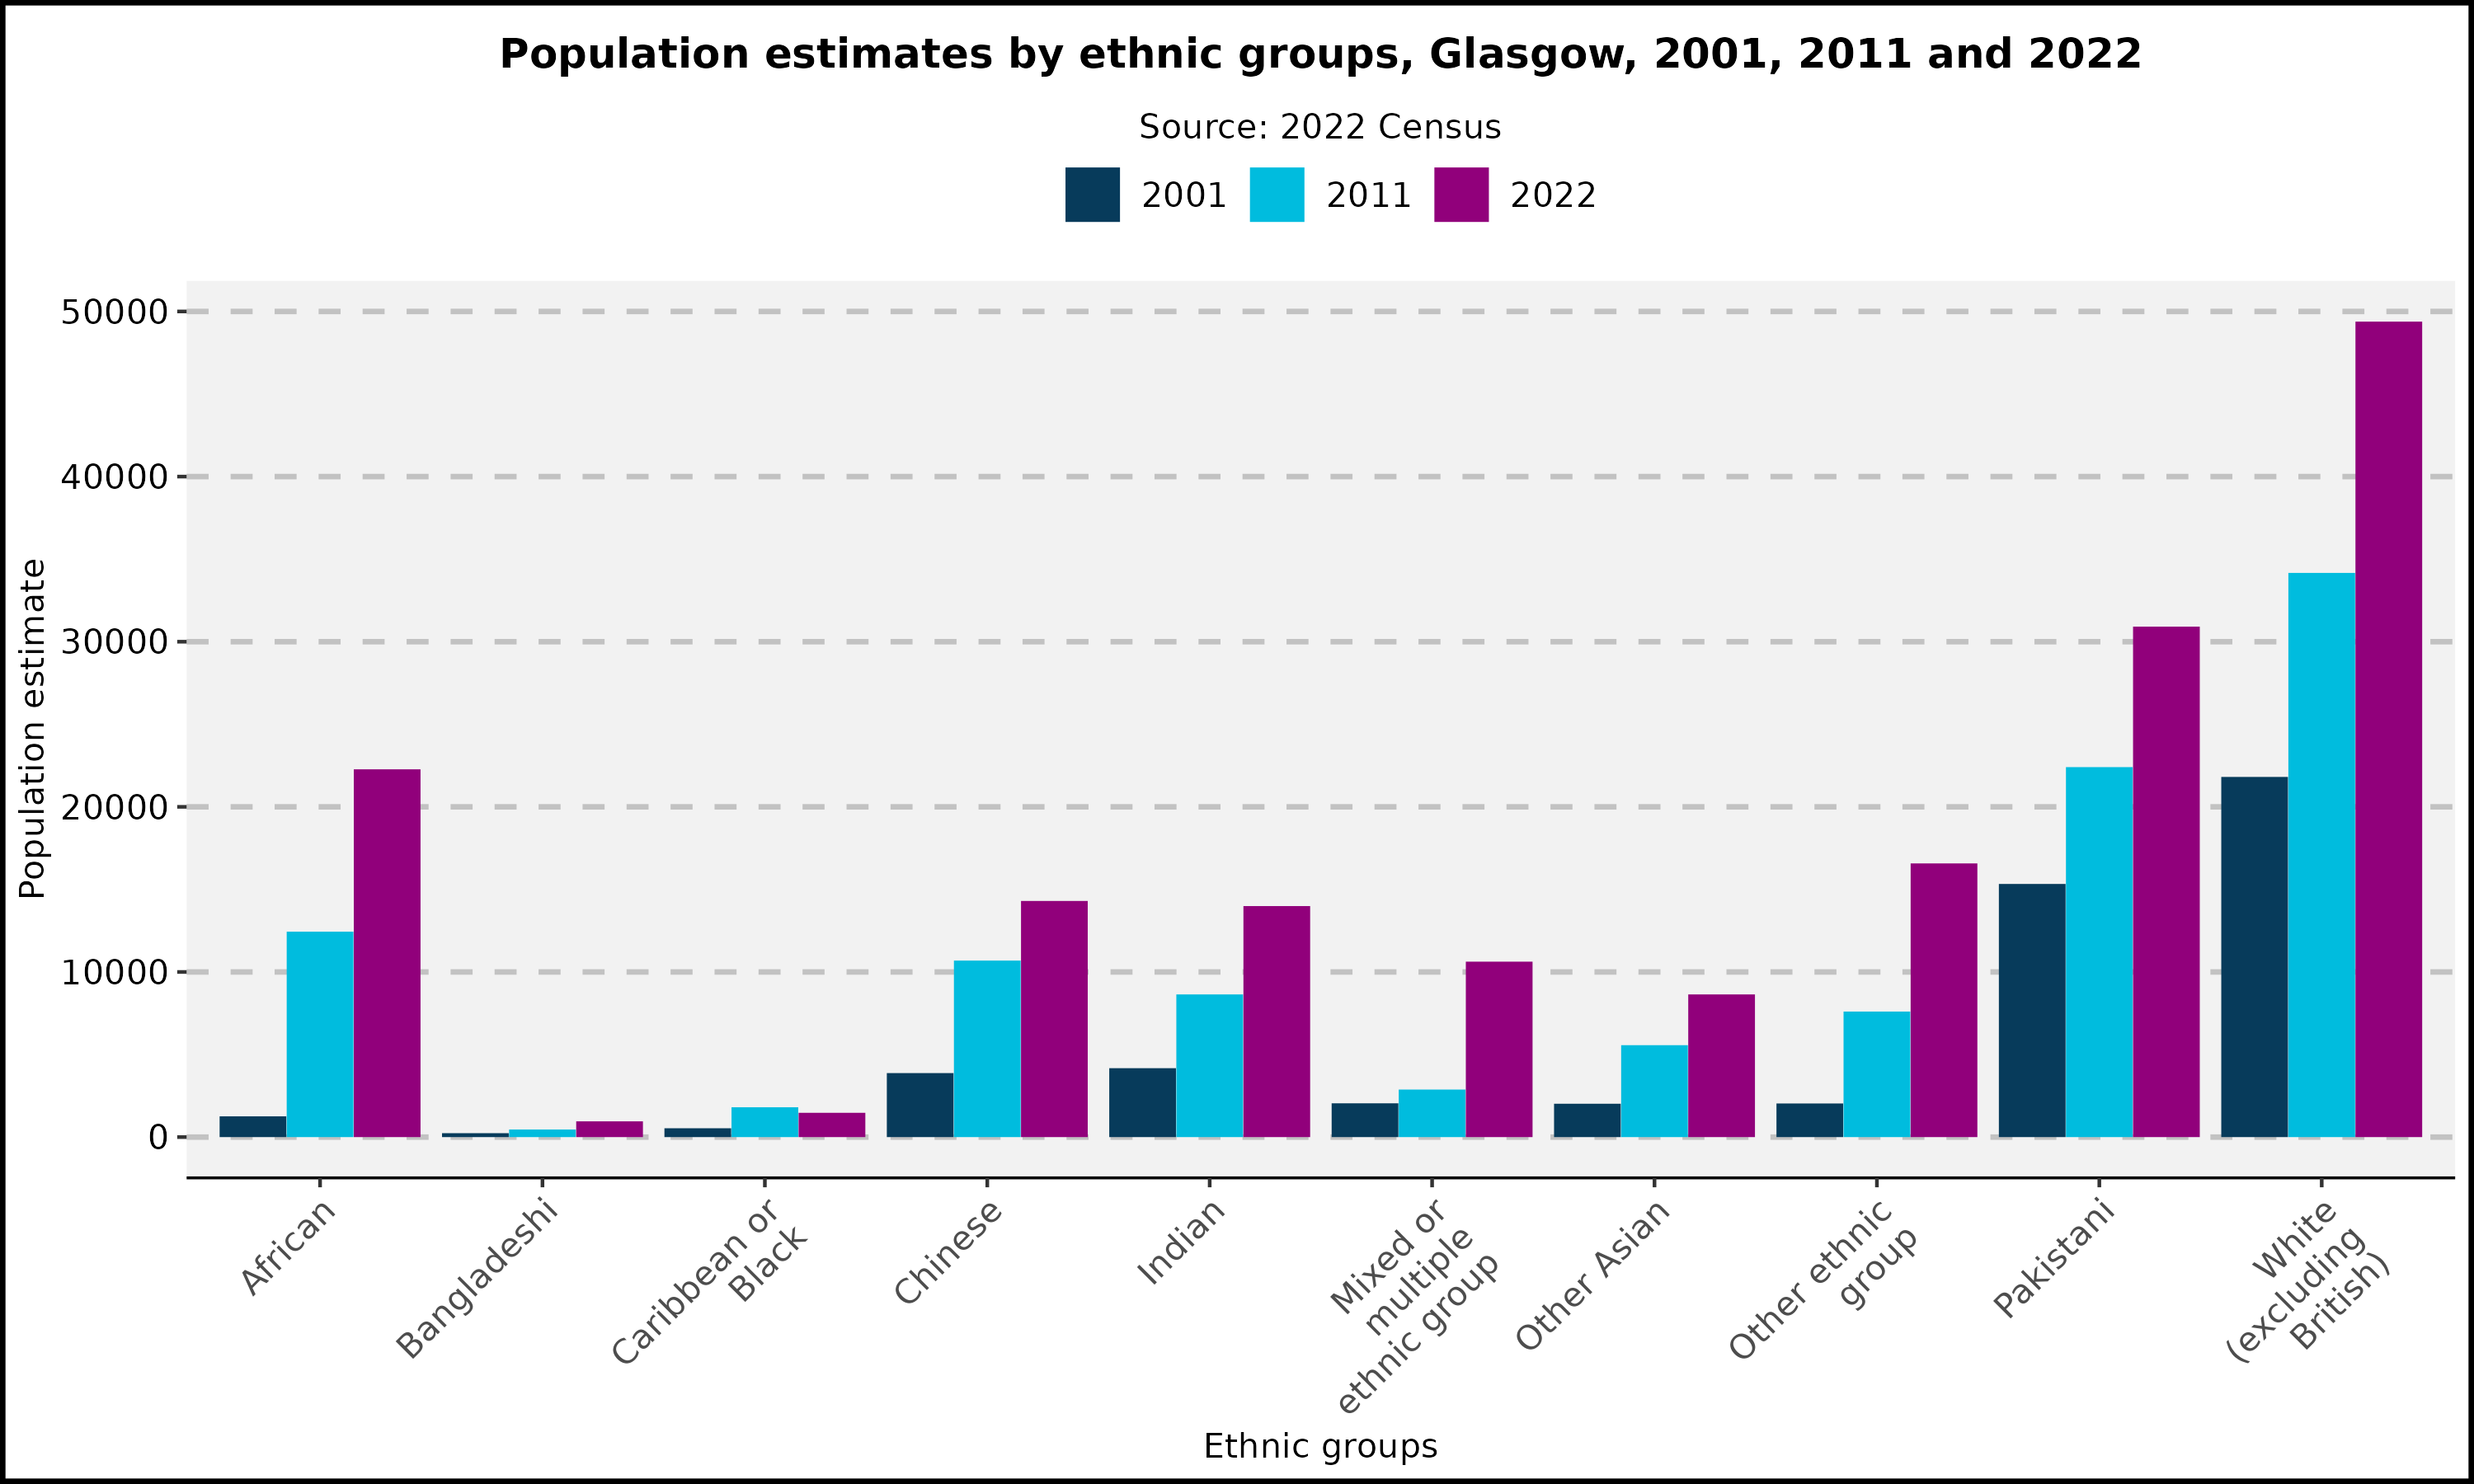
Glasgow’s overall non-white British ethnic population has more than tripled from 53,000 people in 2001 to just under 170,000 in the 2022 Census. The population estimates increased for all ethnic groups for all Census years except for Caribbean or Black in 2022.
Percentage increase in ethnic group population in Glasgow, 2001, 2011 and 2022
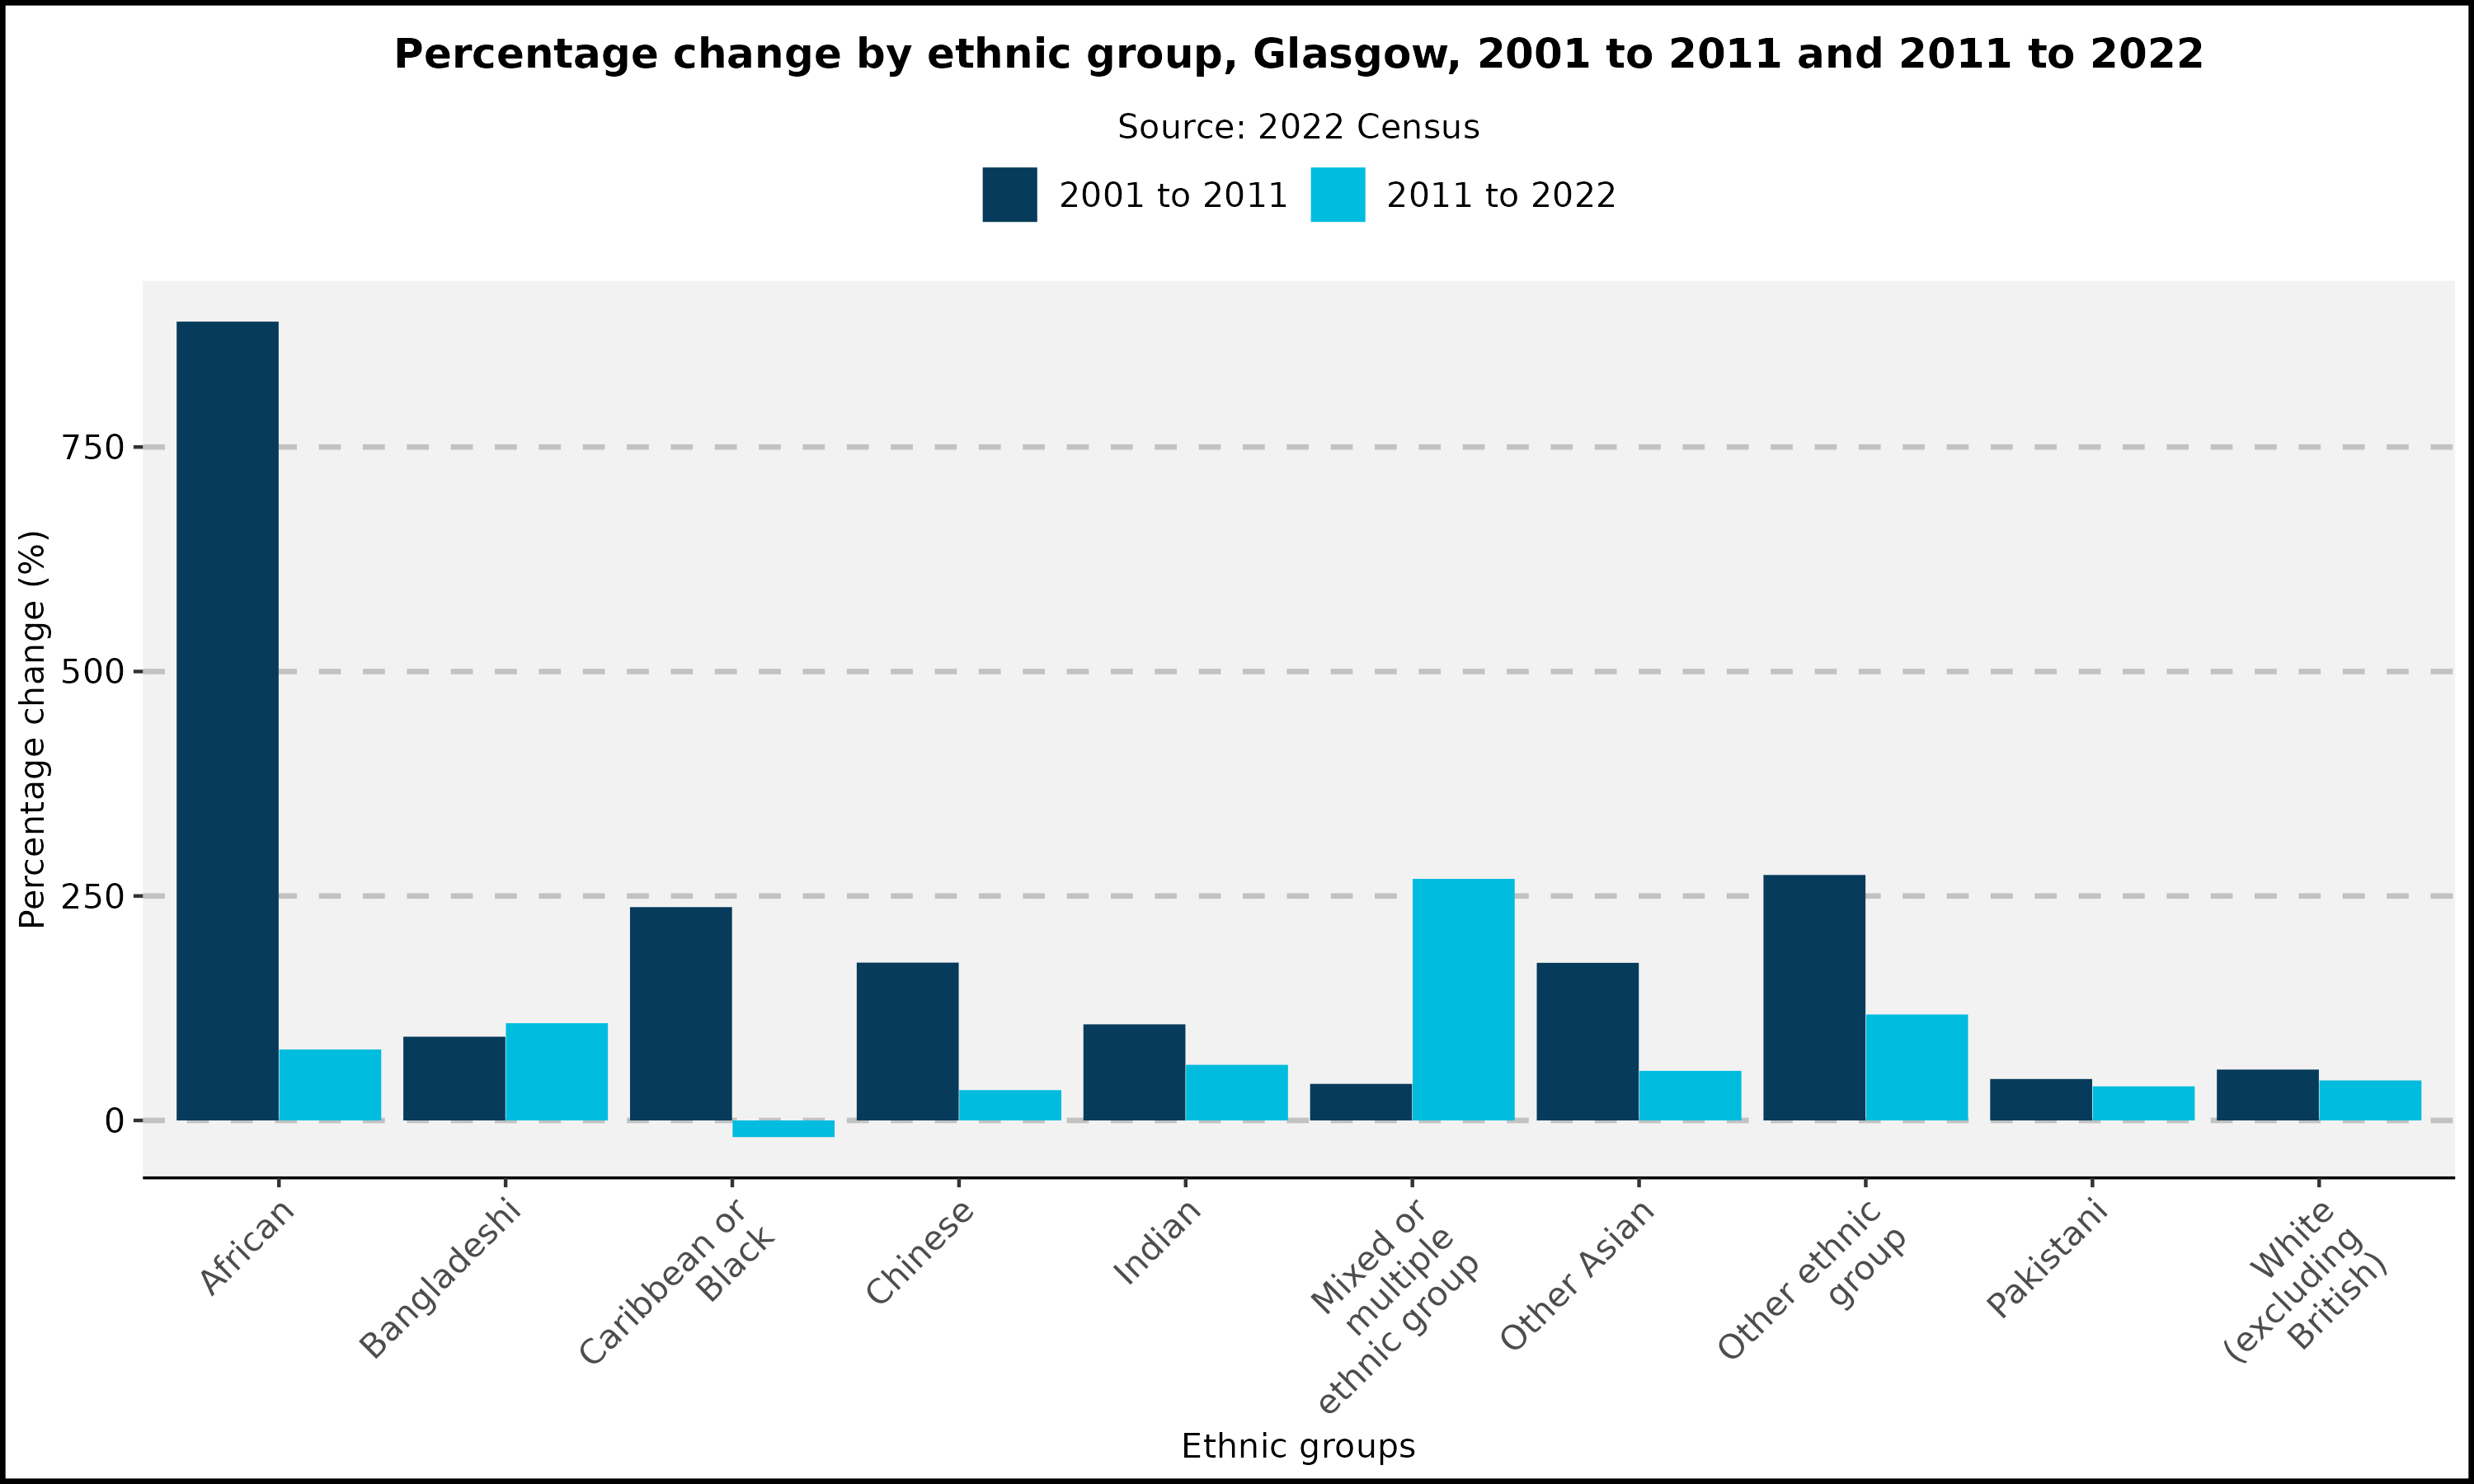
The population size of all ethnic groups increased between 2001 and 2011 and all except Caribbean or Black from 2011 and 2022. The number of people who recorded their ethnic group as African increased by 890% (from 1,257 to 12,440) from 2001 to 2011. The largest increase from 2011 to 2022 was ‘mixed or multiple ethnic group’ with a 269% increase.
Notes
White excludes ‘White British’ and ‘White Scottish’. It includes ‘White: Irish’, ‘White Polish’, and ‘White: Other’.
In October 2025, GCPH published Glasgow City ethnicity profile, which gives a concise profile of Glasgow City’s ethnicity, alongside some important considerations in interpreting profile data. It also introduces some key evidence themes relating to ethnicity, disadvantage and health, and racialised health inequalities overall.
In September 2017, GCPH published a detailed report on ethnicity and health, The changing ethnic profiles of Glasgow and Scotland. This report explored links between ethnicity and health in a Scottish context and the population health implications of the changing ethnic profiles of Scotland and of Glasgow.
This section was last updated in October 2025.