Pollokshields East
*Please note that this profile is based on data from the 2022 Census.*
Download a printer-friendly version of this profile here
Pollokshields East has a population of 2,781 children and young people (aged 0–24 years).
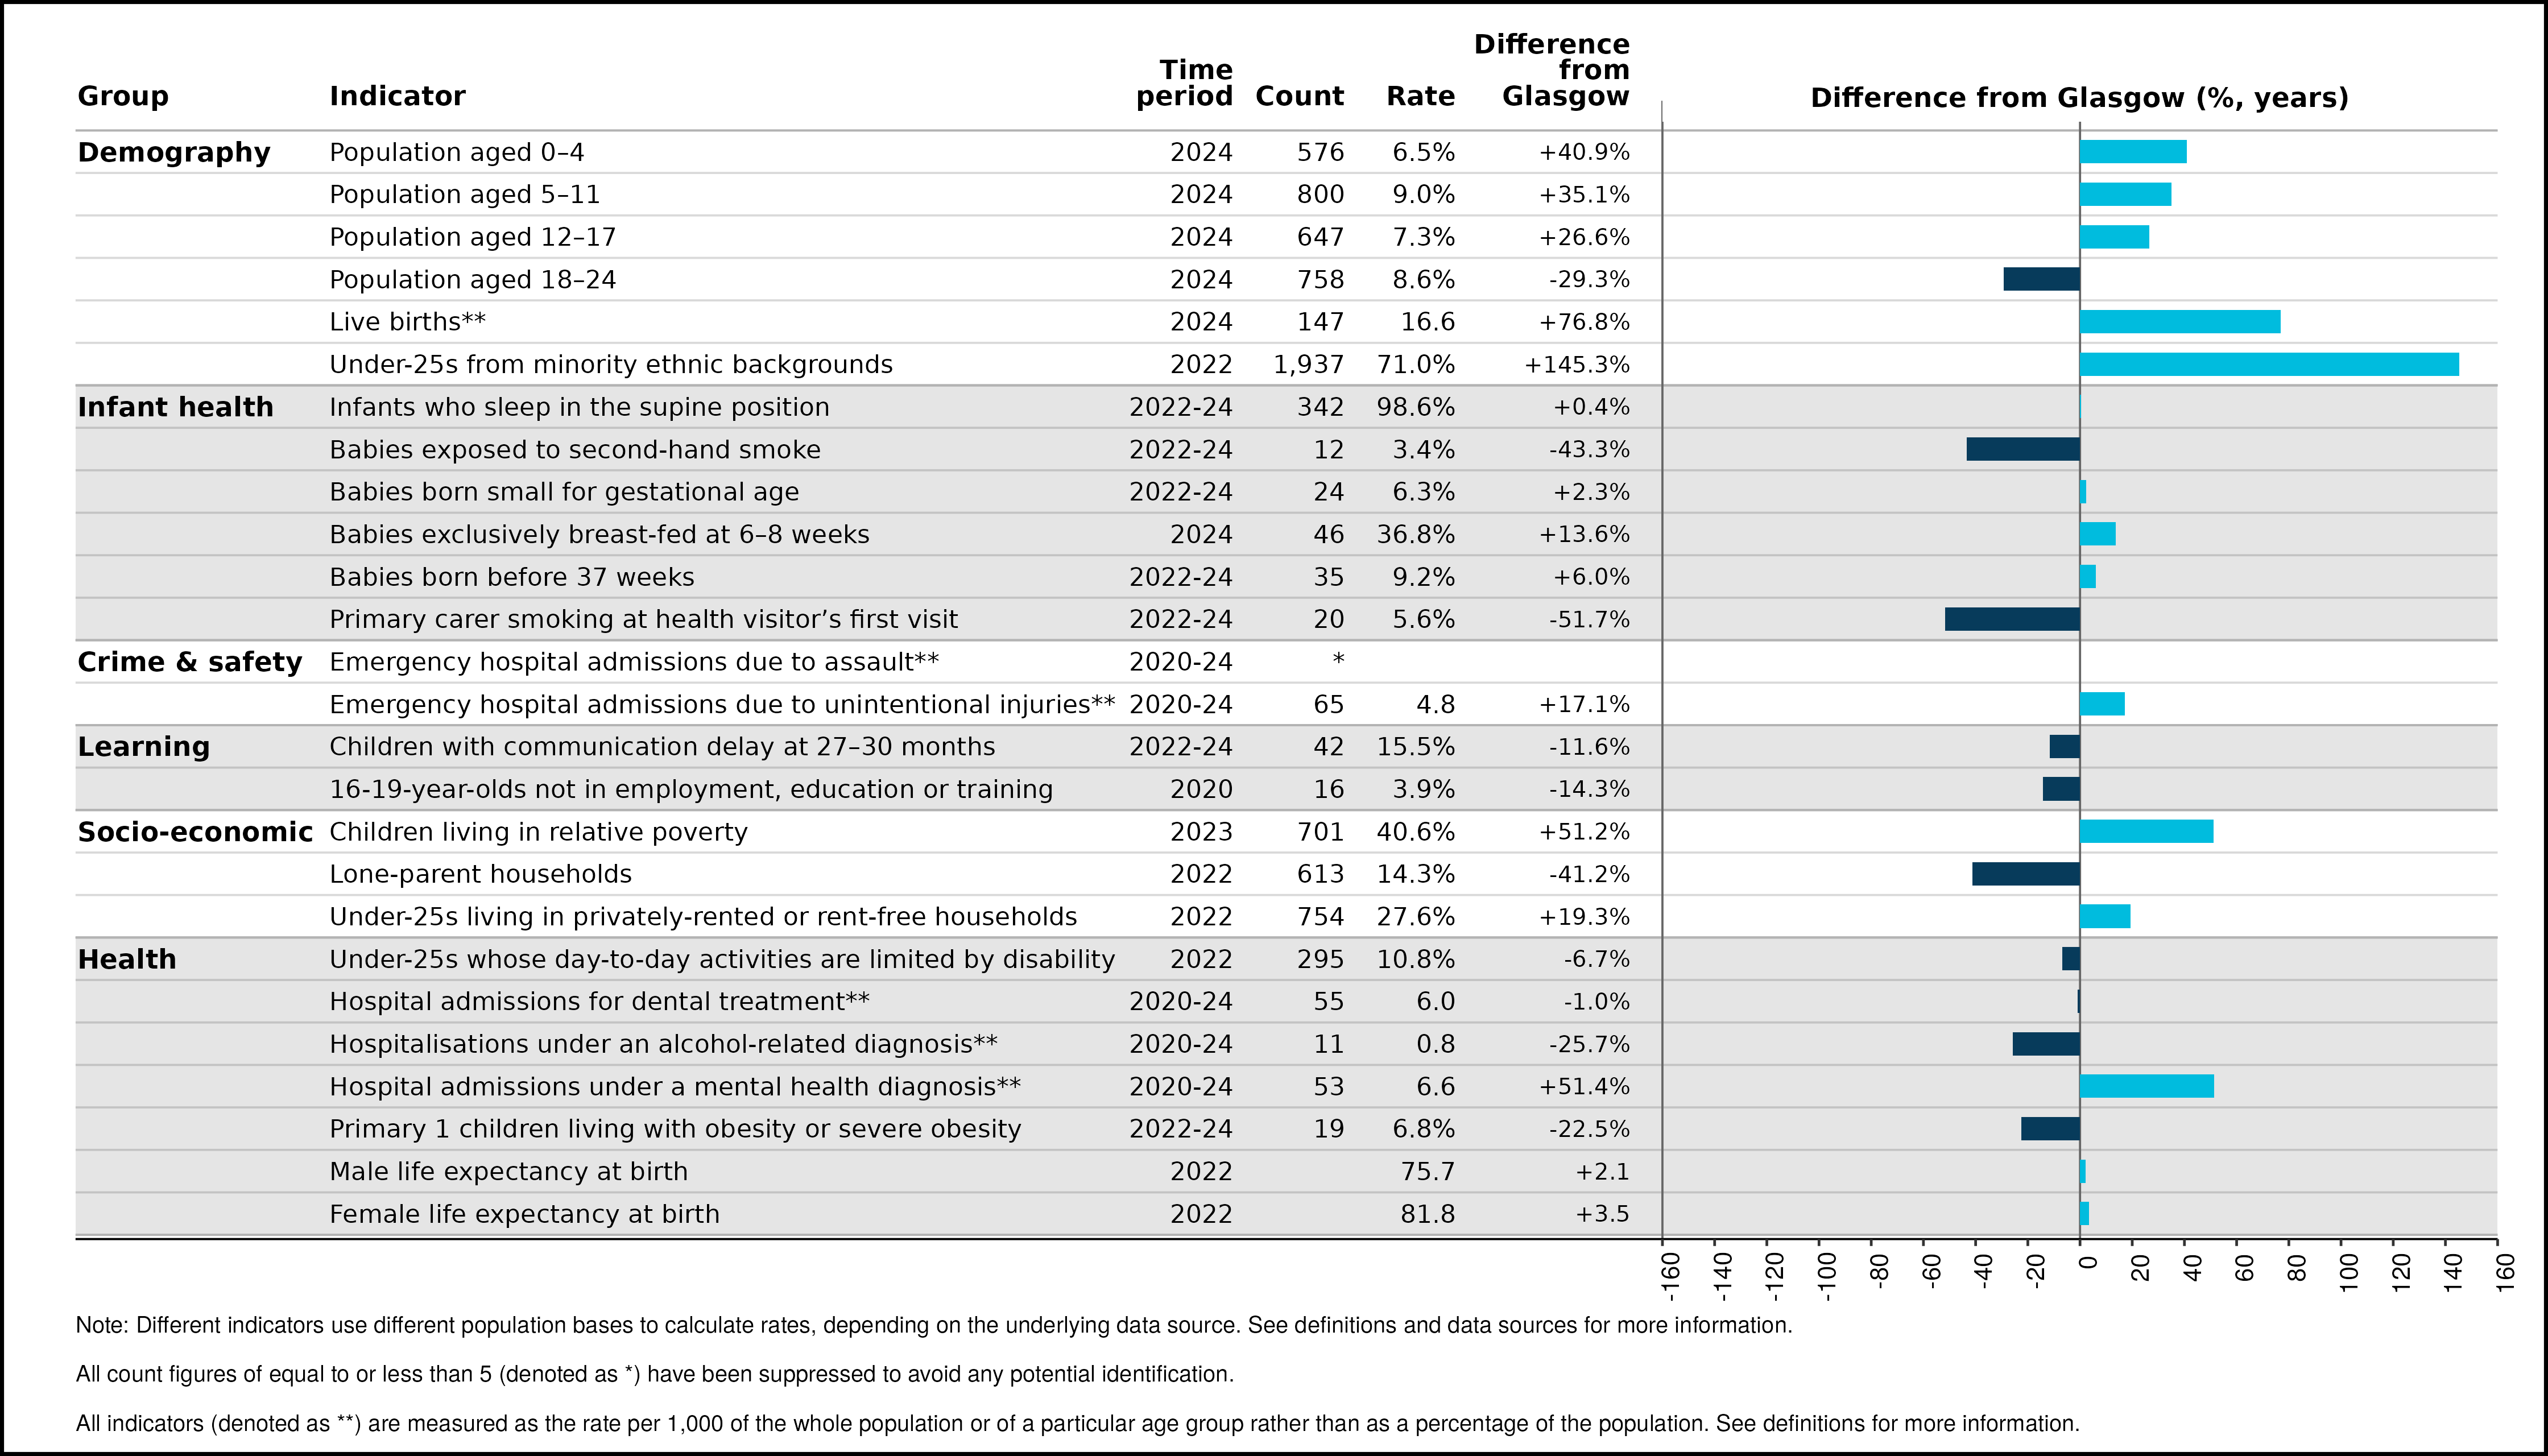
Neighbourhood comparisons with Glasgow
There is a high proportion of 0–17-year-olds in Pollokshields East, while 18–24-year-olds are 29% lower than the Glasgow average. A high proportion of under-25s are from minority ethnic backgrounds (71%), which is 145% higher than Glasgow. Live births are also significantly higher, 77% higher than the average, as are children living in relative poverty and hospital admissions under a mental health diagnosis (both 51% higher). Life expectancy is higher in 2022 for both sexes compared to the Glasgow average and lower than the Scottish average for males. Female life expectancy, however, is higher than the Scottish average.
Neighbourhood trends
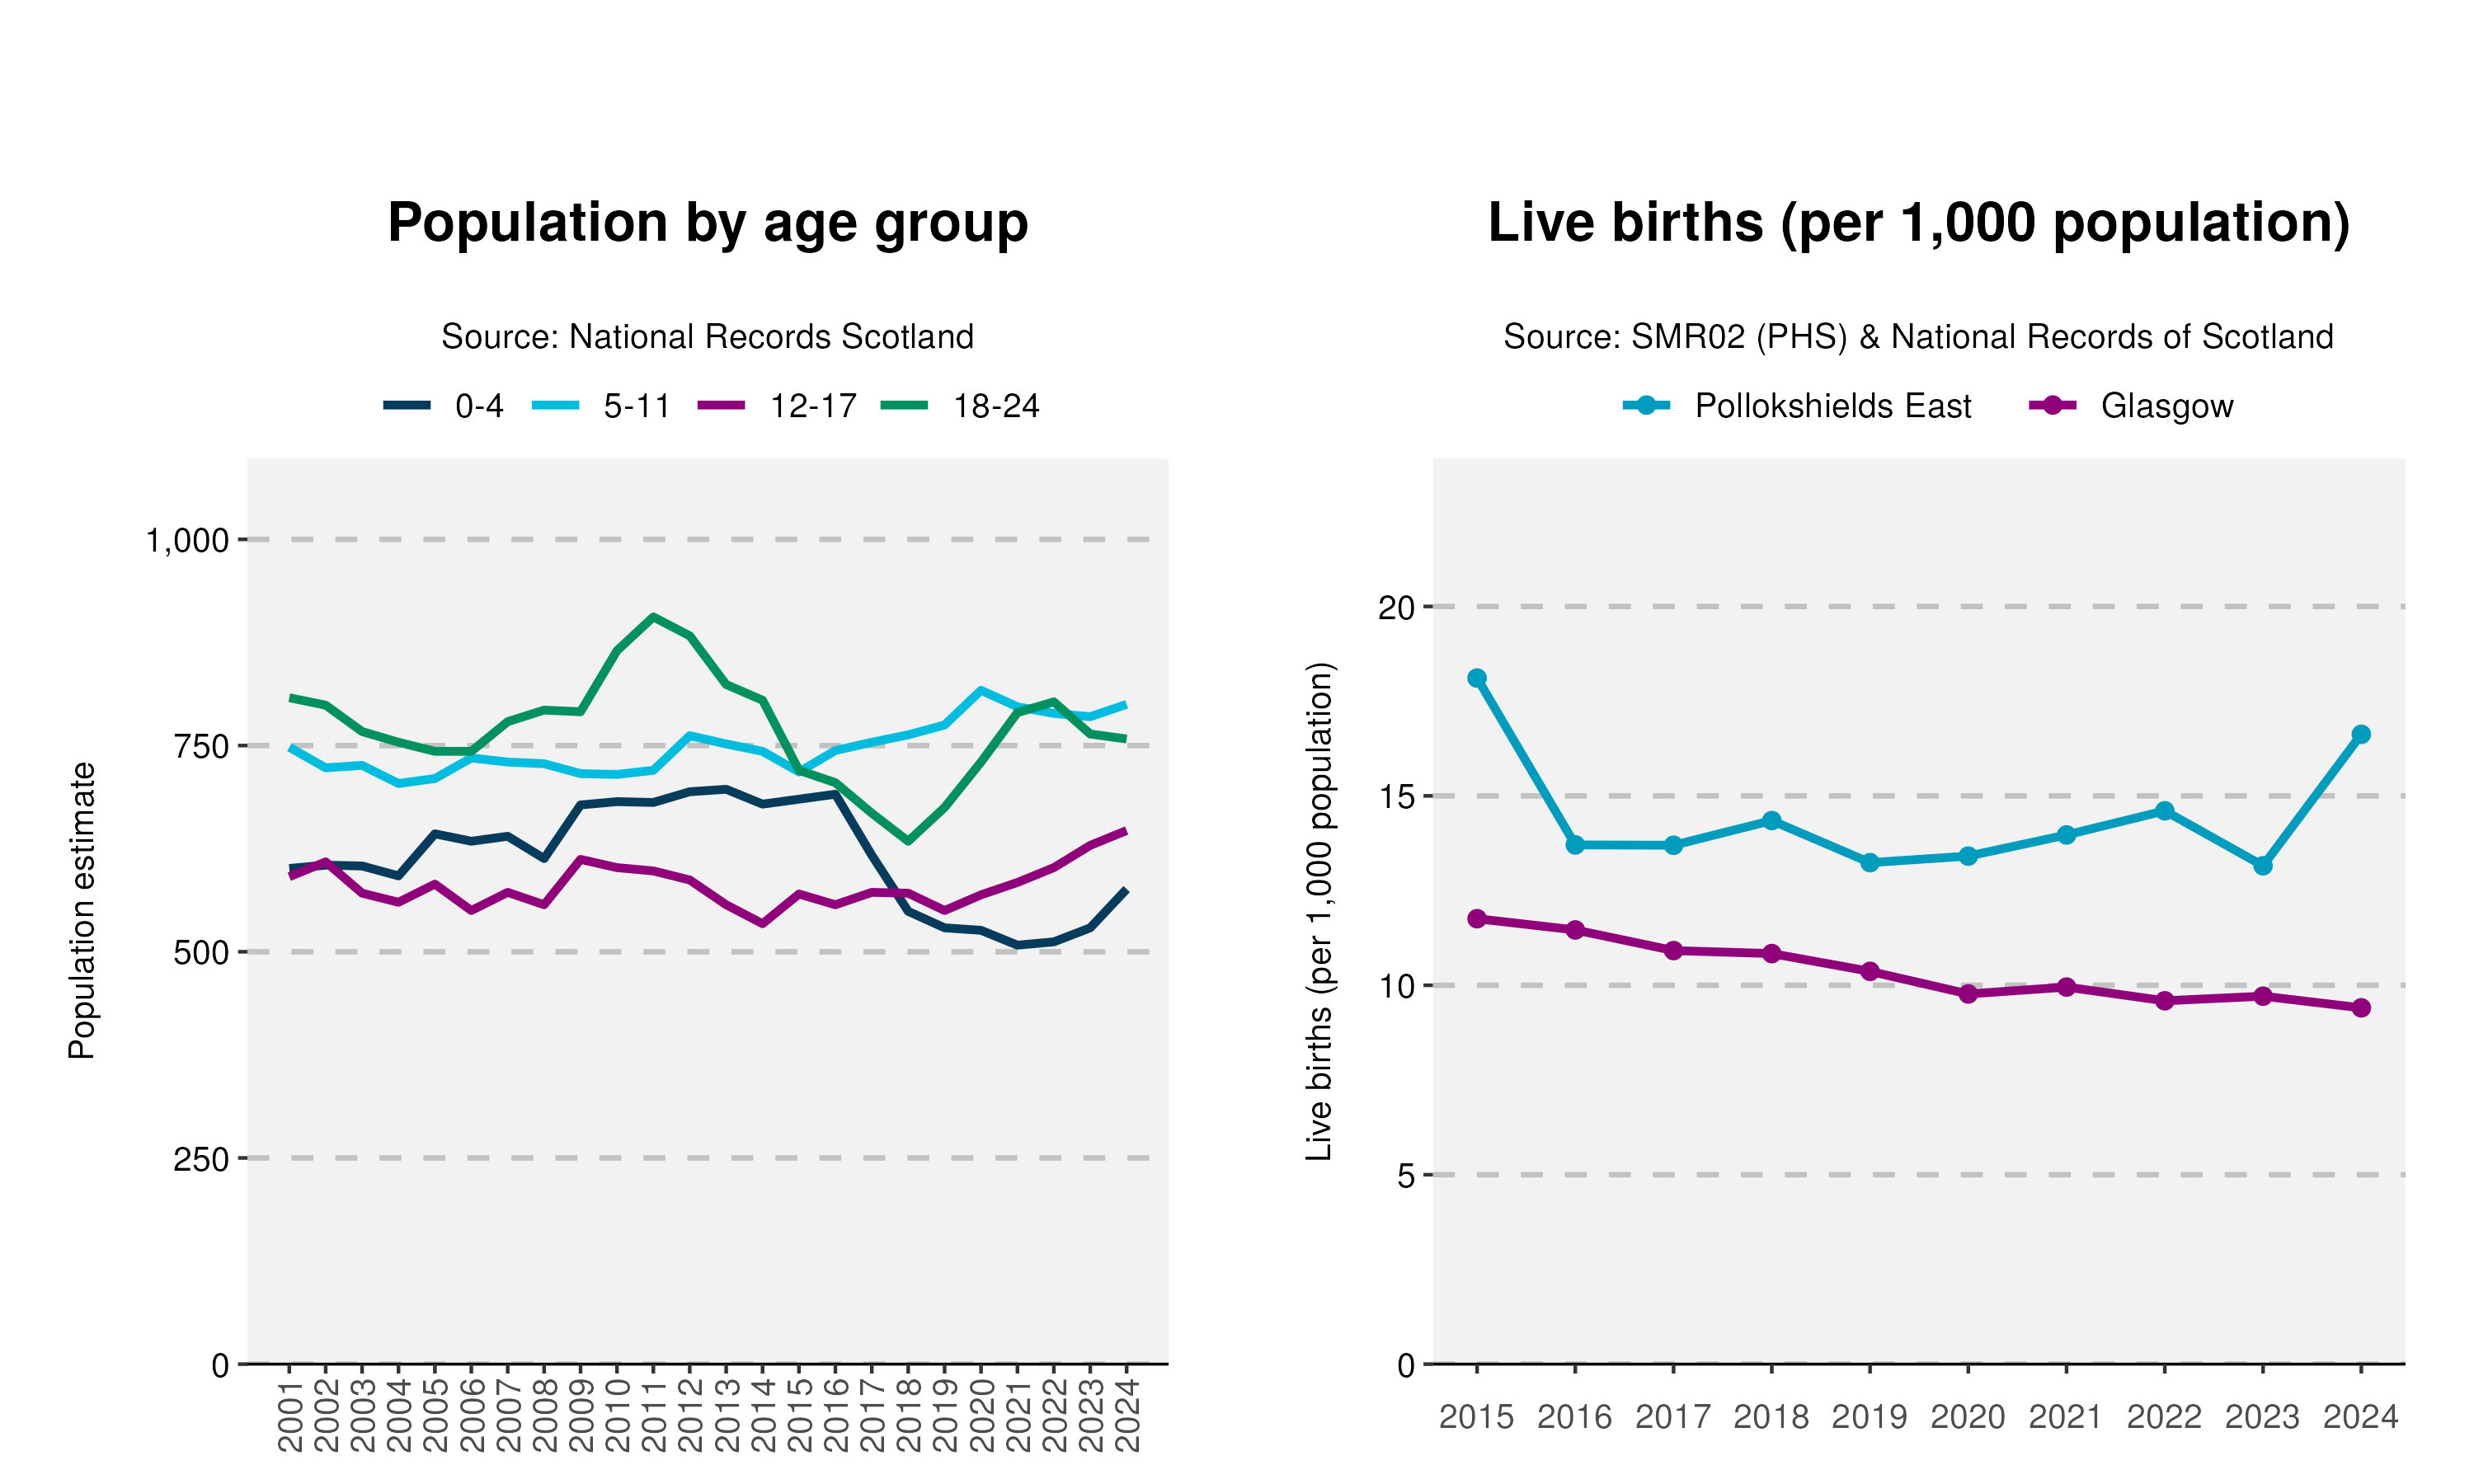
The population of young people aged 18–24 years has fluctuated over the time period, which has resulted in an overall decrease of 6% for this age group. Live births in Pollokshields East have fallen since 2015 through to 2023 and increased significantly in 2024, throughout the time period they have always been above the Glasgow average.
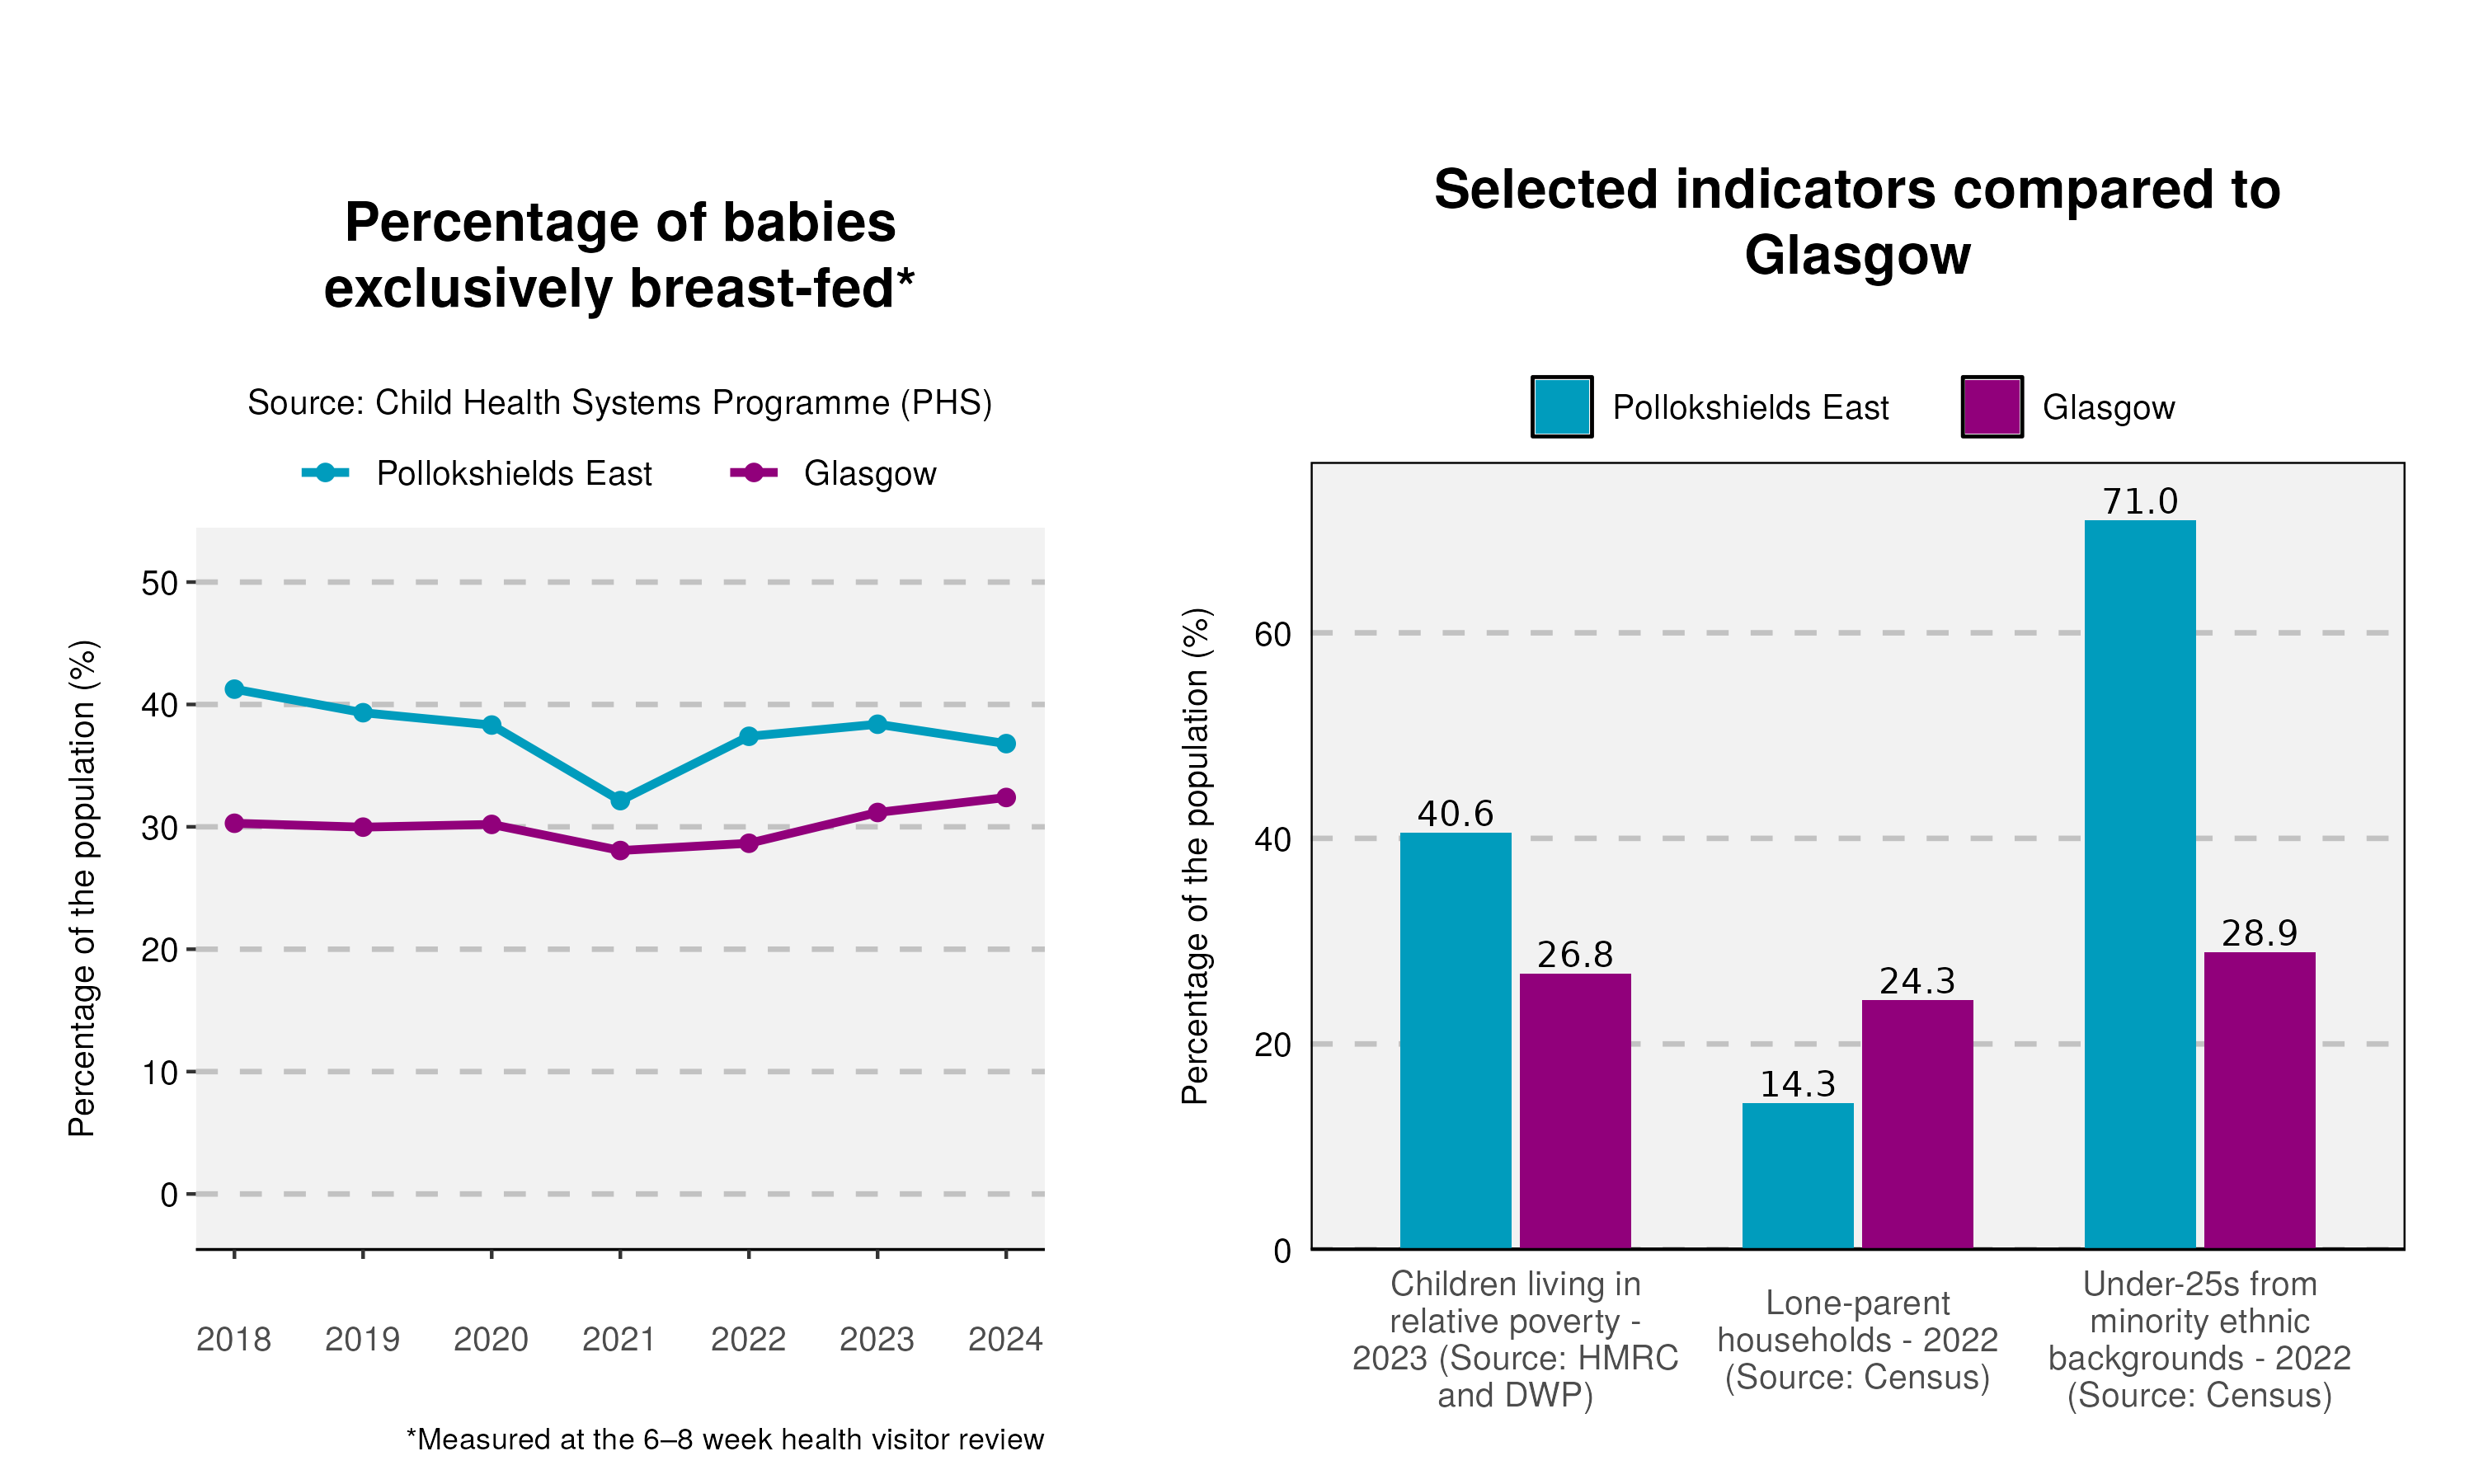
The proportion of babies exclusively breast-fed at 6-8 weeks varies over time but remains higher than the Glasgow average, reaching 37% in 2024. The percentage of children living in relative poverty and under-25s from a minority ethnic background in particular are above the Glasgow average, whereas lone-parent households is below the average.
Notes
An Excel workbook containing the data used in all of the profiles can be downloaded here. This workbook also includes alternative output formats and further breakdowns of some of the variables.
1. Data sources: Scottish Index of Multiple Deprivation (SIMD) 2020; Census (2001, 2011 and 2022); National Records of Scotland (NRS); Scottish Morbidity Records (SMR01 and SMR02); Child Health Systems Programme (CHSP) and CHSP Schools; Department for Work and Pensions (DWP); HM Revenue and Customs (HMRC).
2. All count figures of less than five (denoted as *) have been suppressed to avoid any potential identification.
3. This publication has used small area population estimate data published by the NRS on 24 February 2026. This is presented in the population trend chart and used to calculate life expectancy estimates. The NRS update their small area population estimates and previous estimates on an annual basis therefore this data is only representative of the data published upon this date. For further information see: https://www.nrscotland.gov.uk/publications/small-area-population-estimates-mid-2023-and-mid-2024-2011-data-zones/
4. Life expectancies are calculated based on population estimates and death registrations. 95% confidence intervals have been added on the graphs to the neighbourhood data to give an indication of their accuracy. The 95% confidence interval for the Glasgow and/or Scotland comparison line has been removed due to the size of the population. This resulted in the confidence interval sitting on the data line making it unreadable. The x-axes of the life expectancy graphs give the mid-year for each life expectancy estimate e.g. 2020 represents the life expectancy estimate for the period 2018-2022.
5. A notes and definitions document providing further information on the variables presented in the profile can be found in the Profiles section of the Understanding Glasgow website: https://www.understandingglasgow.com/profiles/children-young-people-s-profiles.