Balornock and Barmulloch
*Please note that this profile is based on data from the 2022 Census.*
Download a printer friendly version of Balornock and Barmulloch here
Balornock and Barmulloch is a neighbourhood in the north east of Glasgow with a population of 8,050.

Neighbourhood comparisons with Glasgow
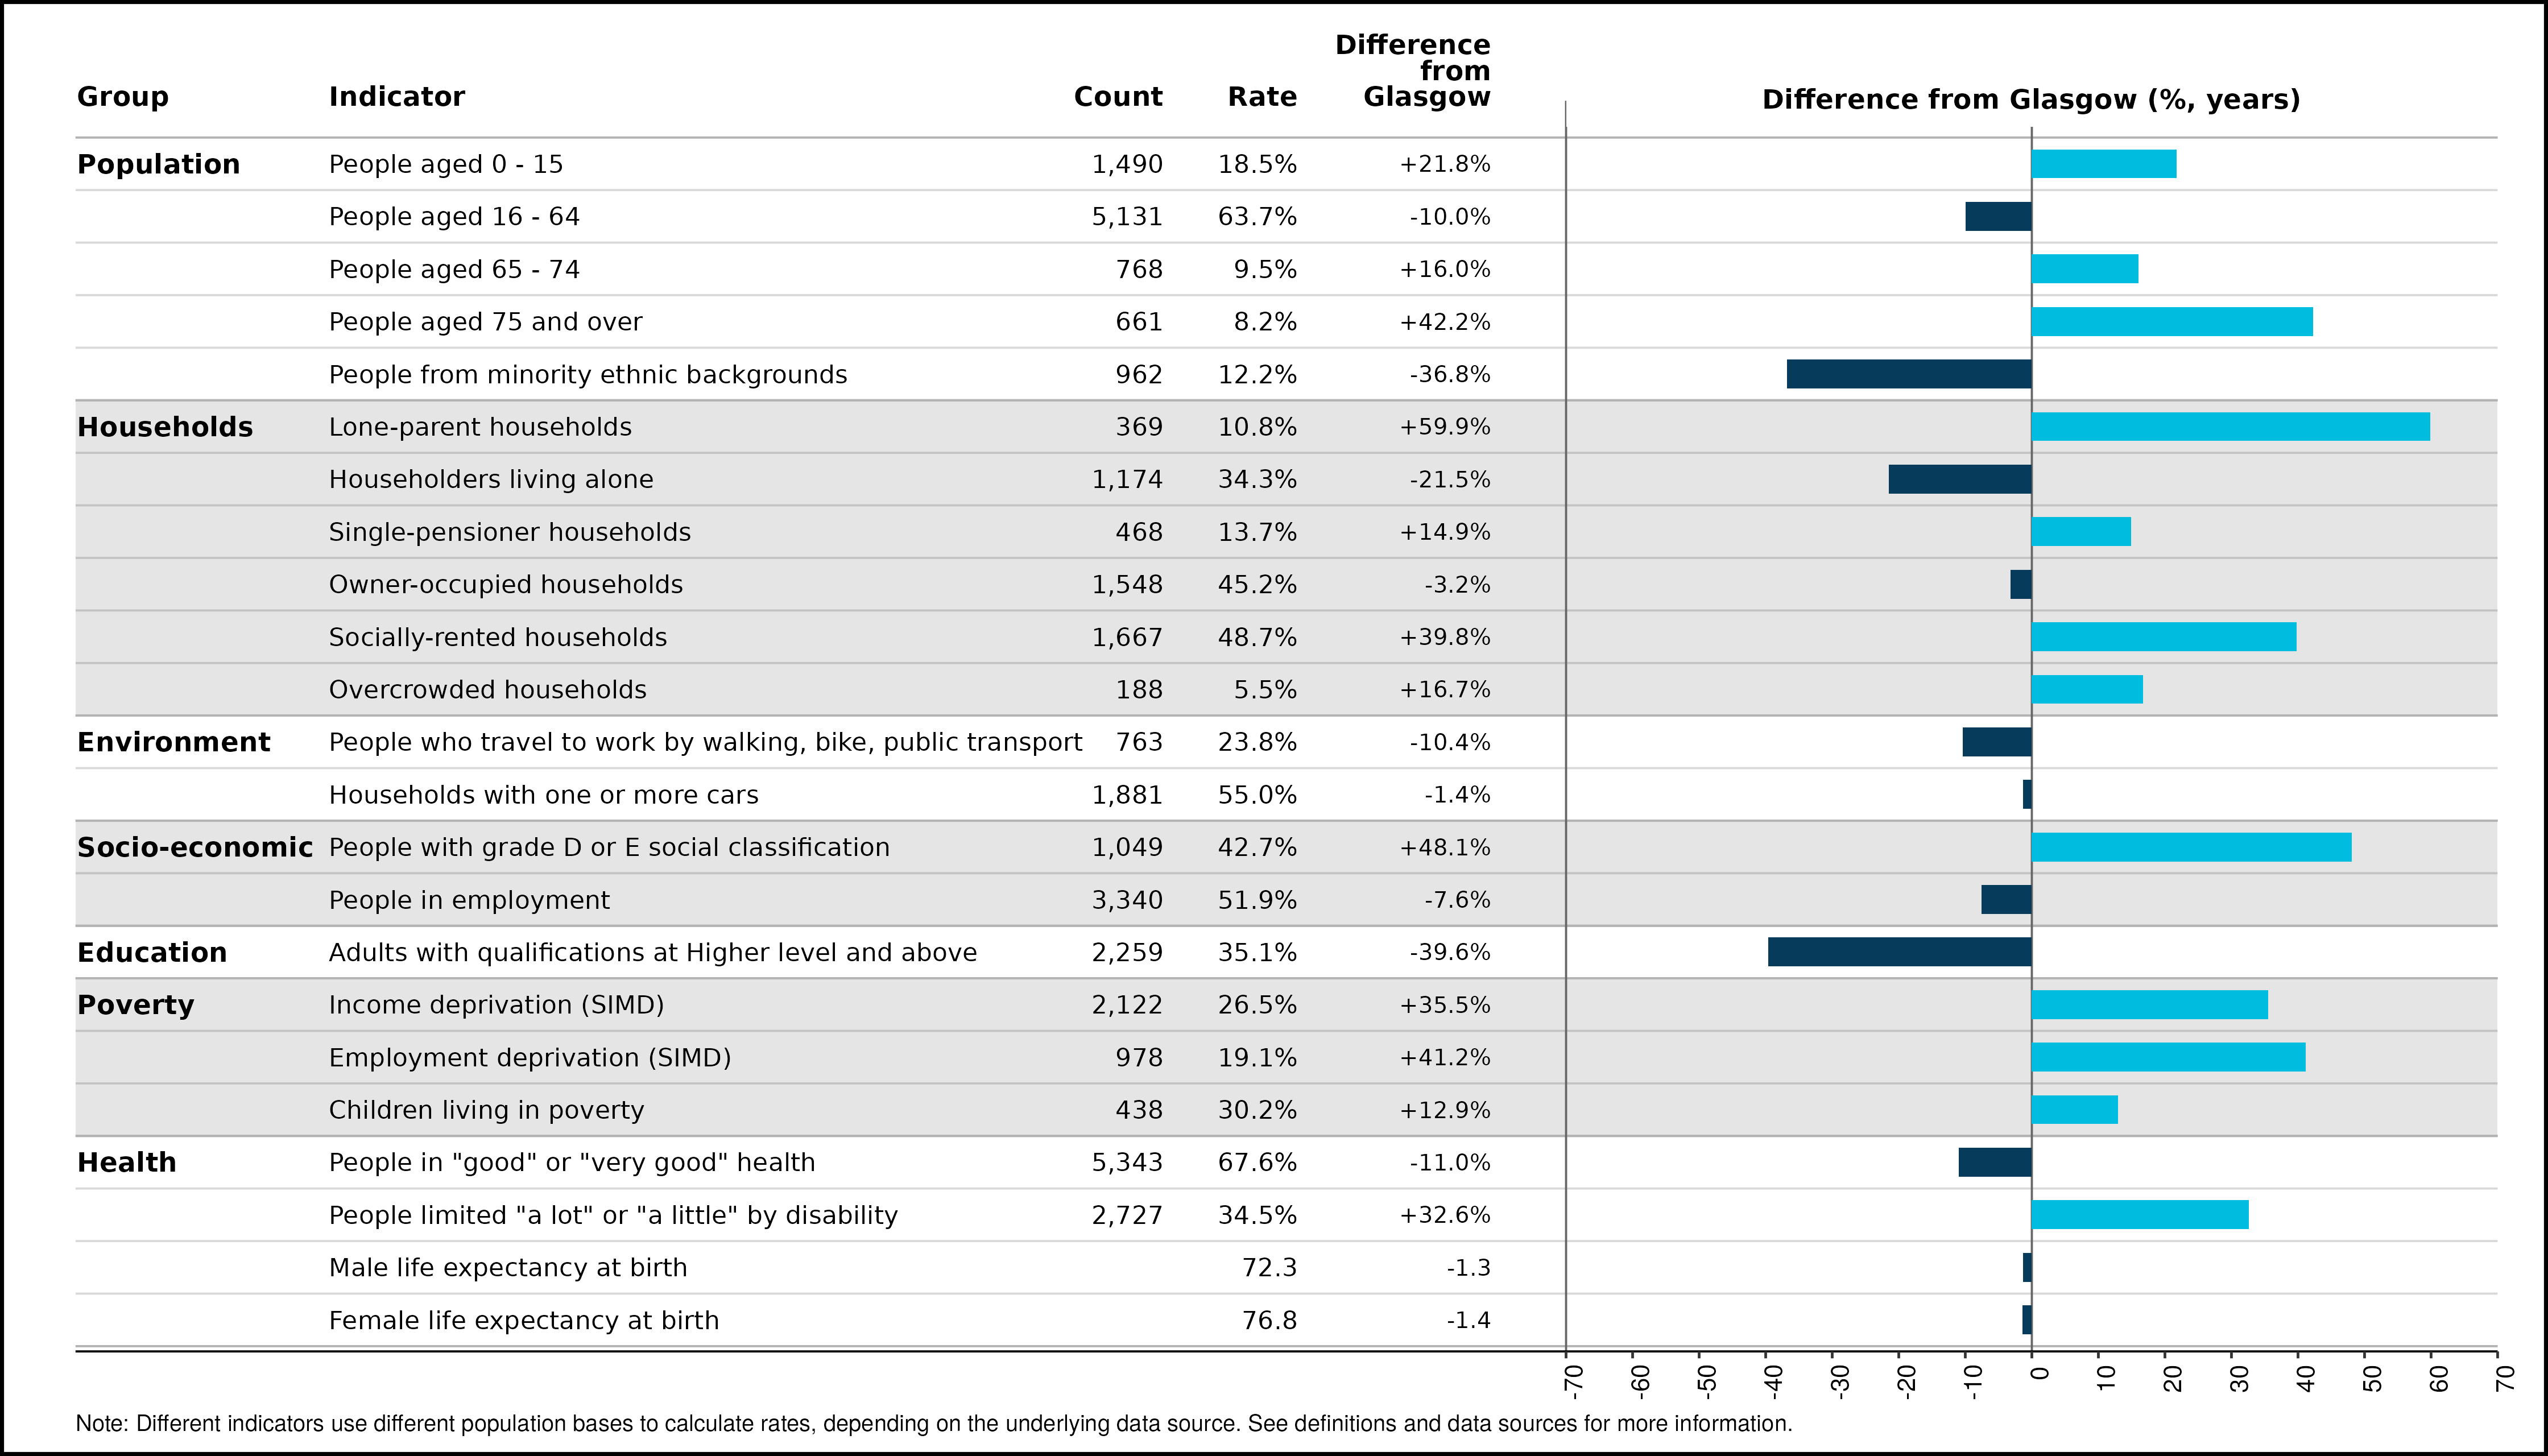
Women in Balornock and Barmulloch live, on average, four and a half years longer than men. The area has a relatively large older population - defined as aged 65 years and over, when compared to Glasgow. The area has higher than average income and employment deprivation. Nearly 50% of the households are socially-rented, this is 40% higher than the Glasgow average.
Neighbourhood trends
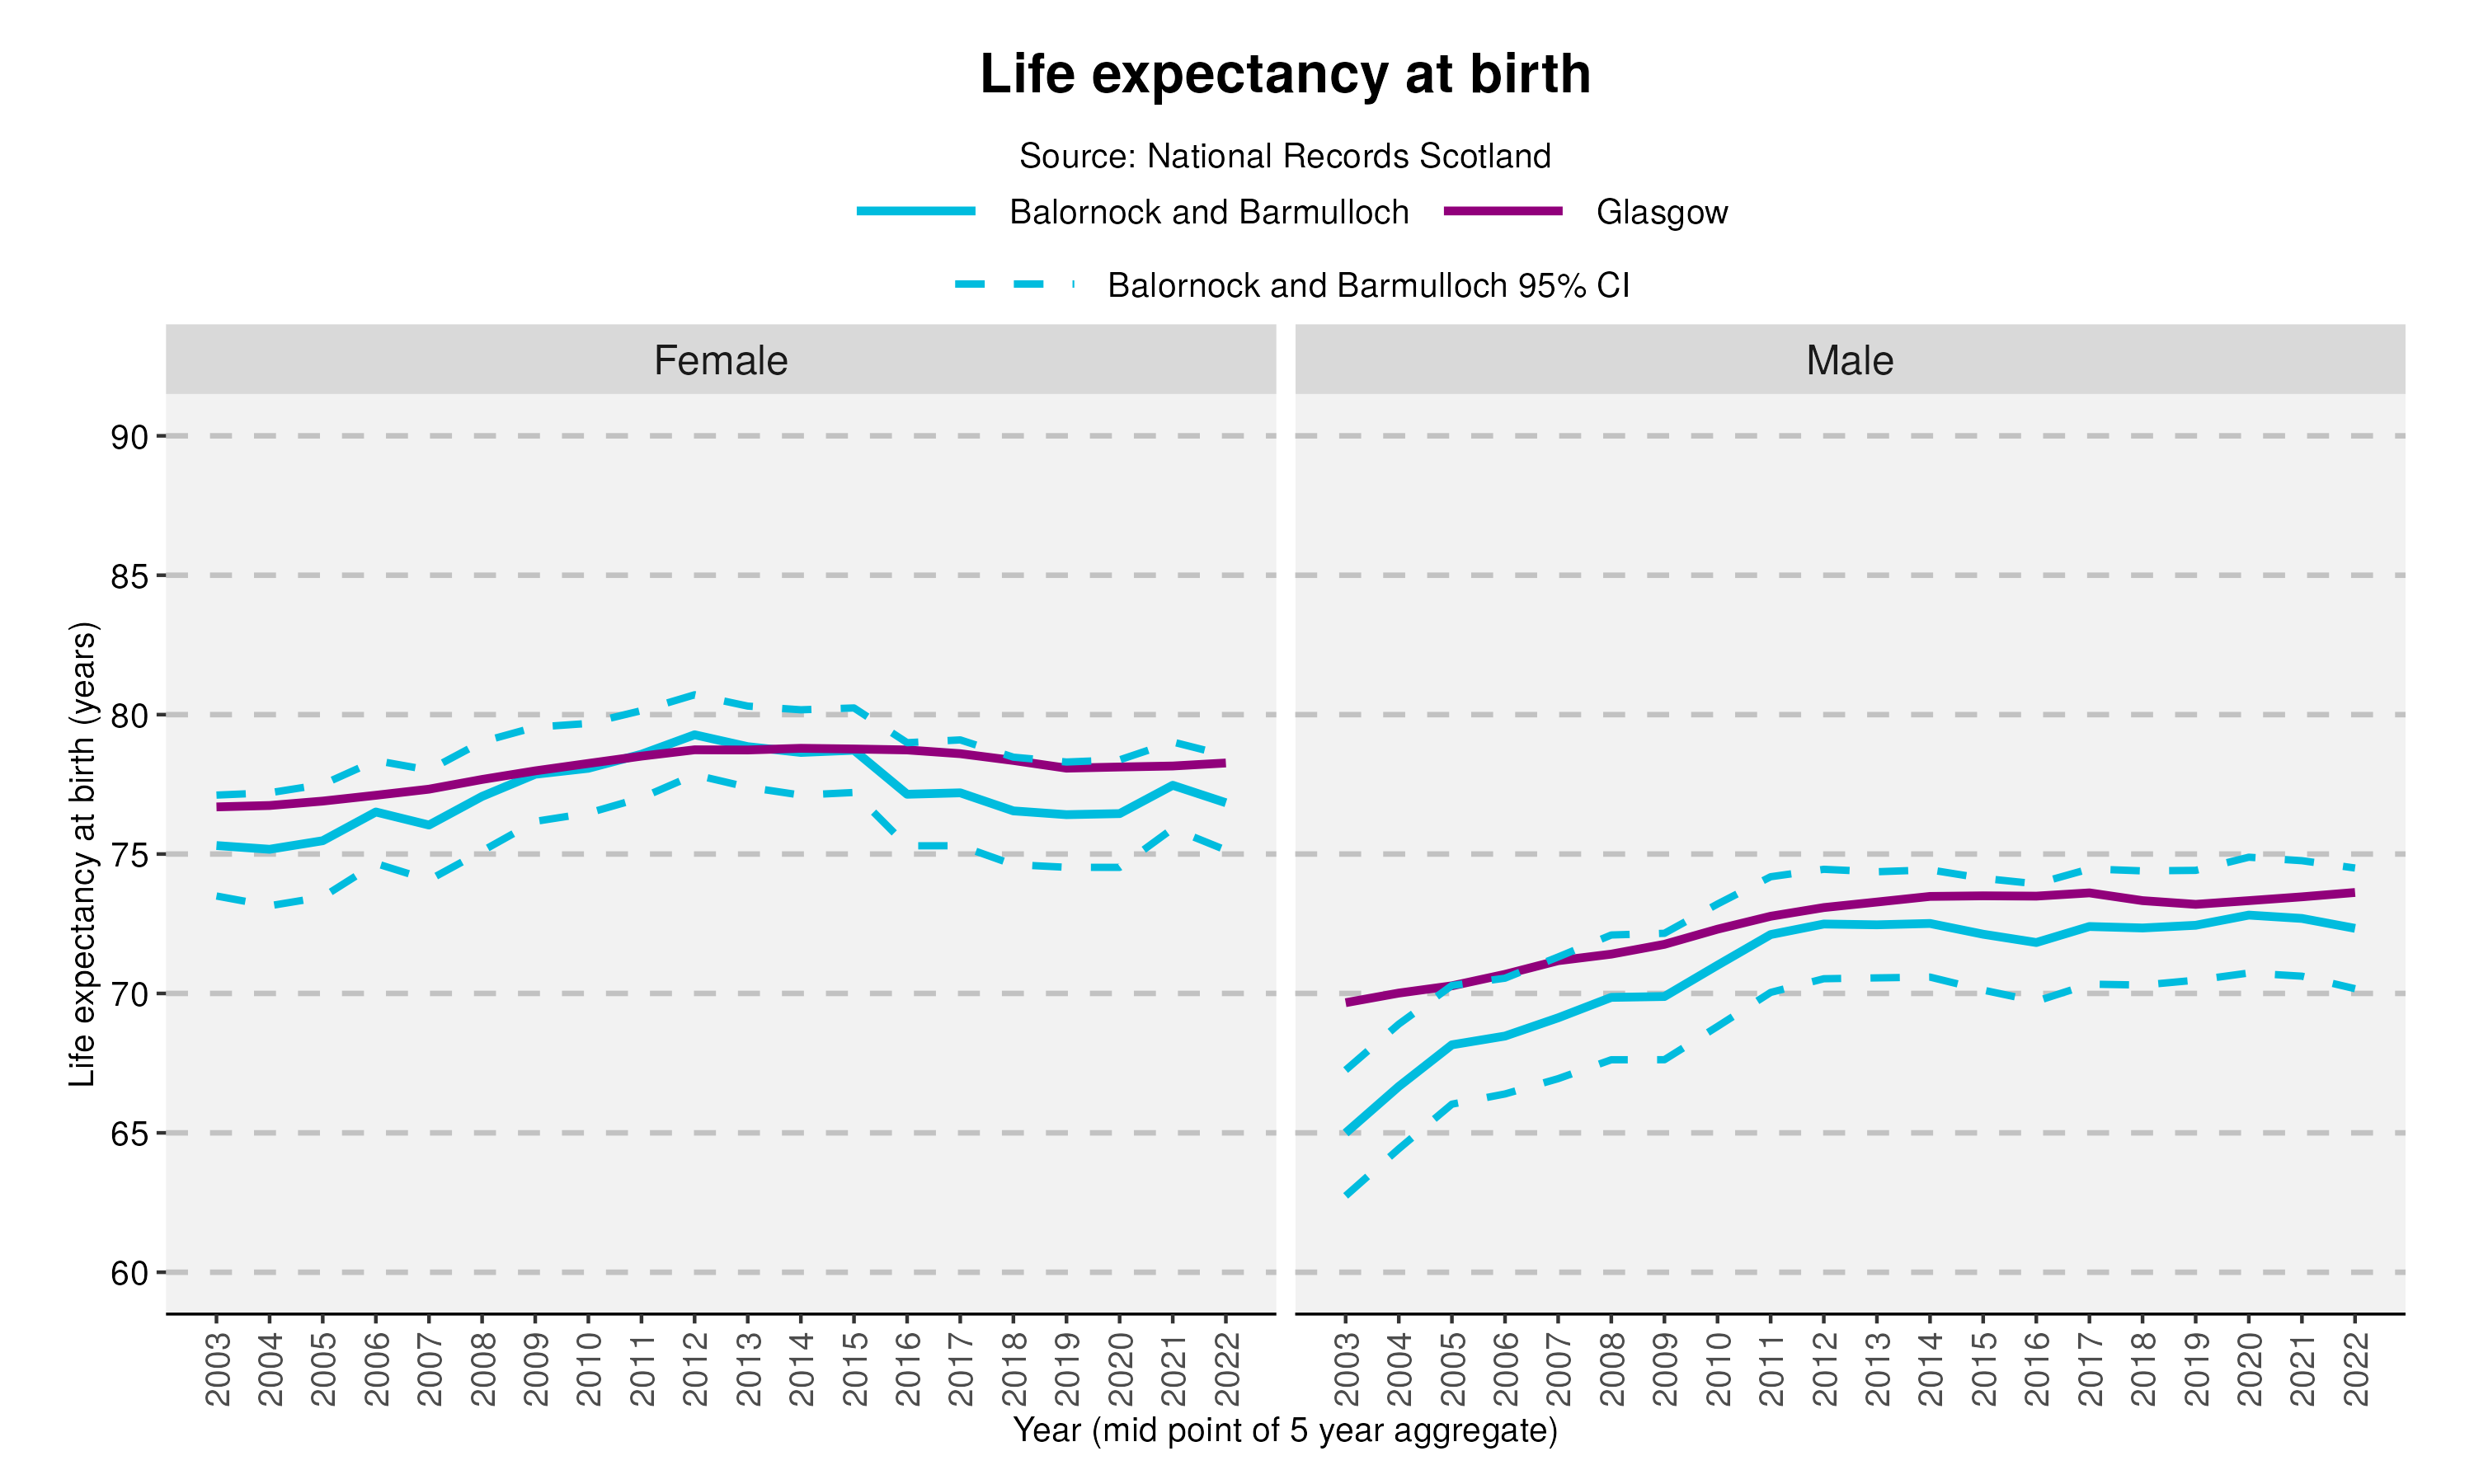
Life expectancy for both males and females has been stable in recent years in Balornock and Barmulloch and is below the Glasgow average. In the most recent period shown (2020-2024), life expectancy in this area is lower than the Scottish average.
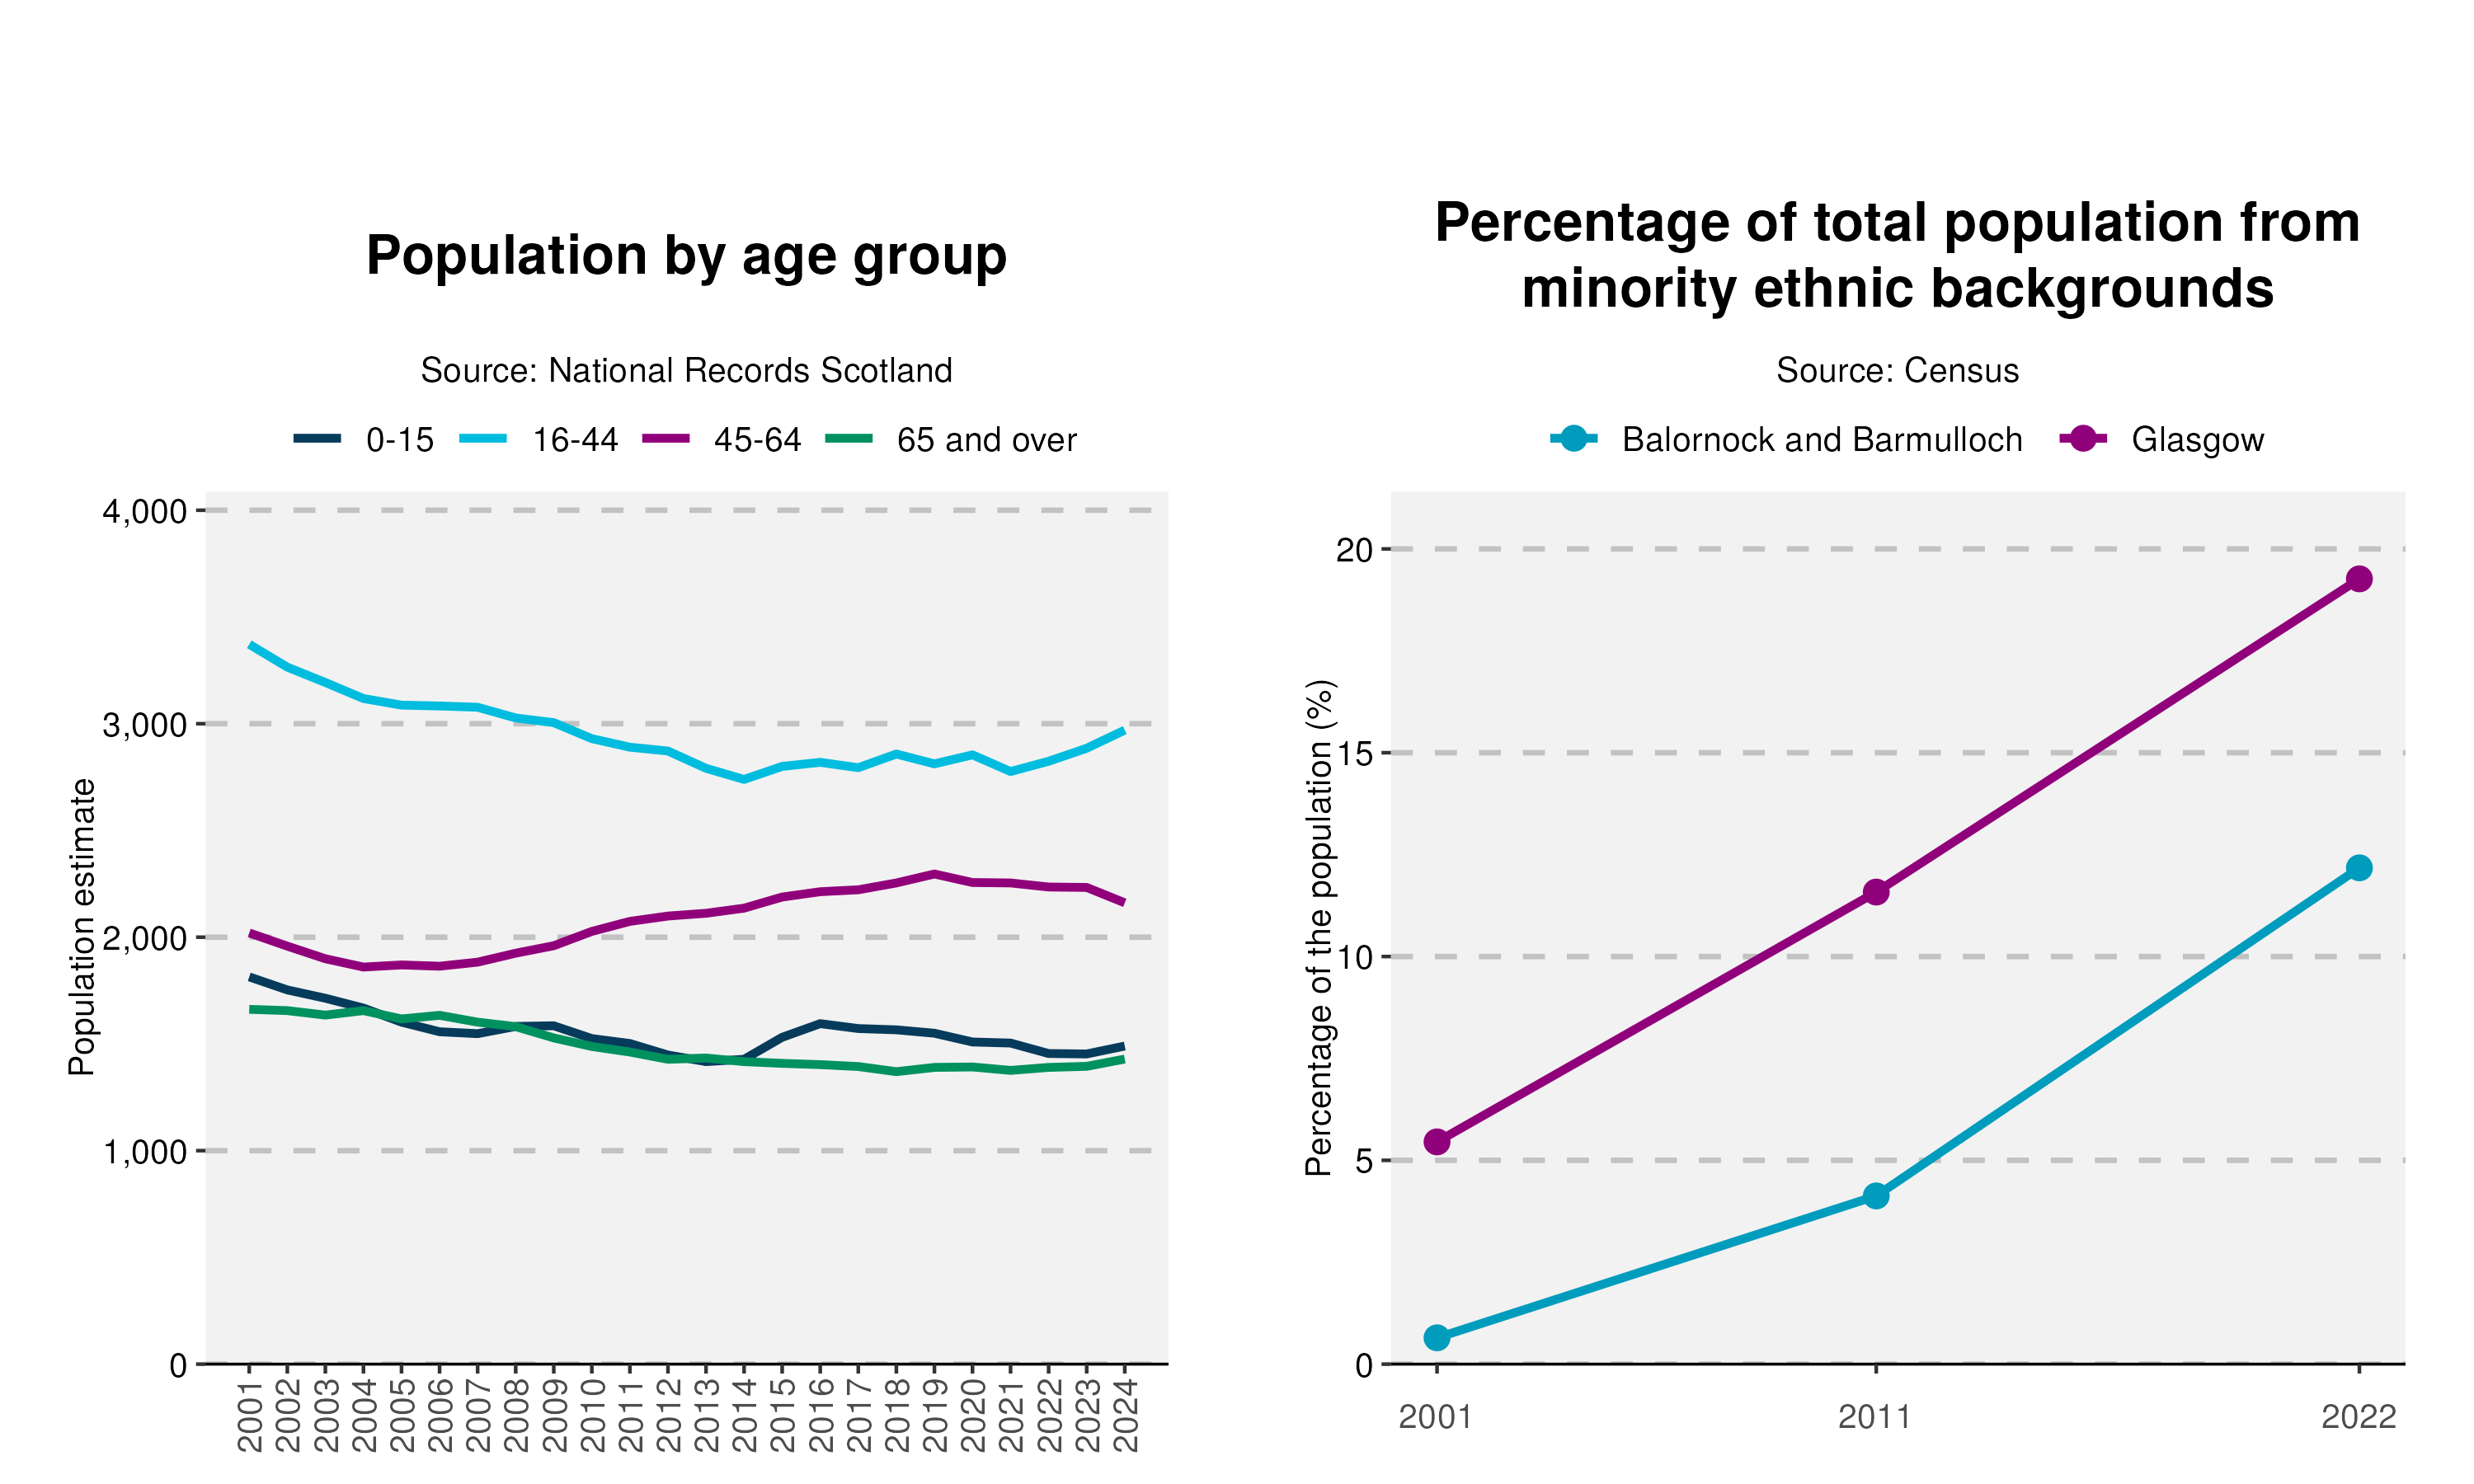
The overall population of Balornock and Barmulloch decreased between 2001 and 2024. This is largely due to a decrease in the number of people aged 16-44. The percentage of the total neighbourhood population from a minority ethnic background increased from 0.6% in 2001 to 12.2% in 2022 but remained below the Glasgow average.
Notes
An Excel workbook containing the data used in all of the profiles can be downloaded here. This workbook also includes alternative output formats and further breakdowns of some of the variables.
- Data sources: Scottish Index of Multiple Deprivation (SIMD) 2020, Census 2022, 2011, and 2001, National Records of Scotland (NRS).
- Populations presented in the population trend chart and used to calculate life expectancy estimates are taken from NRS small area population estimates and are based on: the 2001 and 2011 Census for years 2001-2010; and the 2011 and 2022 Census for years 2011-2024.
- This publication has used small area population estimate data published by the NRS on 24 February 2026. The NRS update their small area population estimates and previous estimates on an annual basis therefore this data is only representative of the data published upon this date. For further information see: https://www.nrscotland.gov.uk/publications/small-area-population-estimates-mid-2023-and-mid-2024-2011-data-zones/
- The Income deprivation and Employment deprivation indicators are derived from SIMD 2020, more information on this deprivation index can be found at: https://www.gov.scot/collections/scottish-index-of-multiple-deprivation-2020/.
- Life expectancies are calculated based on population estimates and death registrations. 95% confidence intervals have been added on the graphs to the neighbourhood data to give an indication of their accuracy. The 95% confidence interval for the Glasgow and/or Scotland comparison line has been removed due to the size of the population. This resulted in the confidence interval sitting on the data line making it unreadable. The x-axes of the life expectancy graphs give the mid-year for each life expectancy estimate e.g. 2020 represents the life expectancy estimate for the period 2018-2022.
- A notes and definitions document providing further information on the variables presented in the profile can be found in the Profiles section of the Understanding Glasgow website: https://www.understandingglasgow.com/profiles/neighbourhood-profiles.