Deprivation
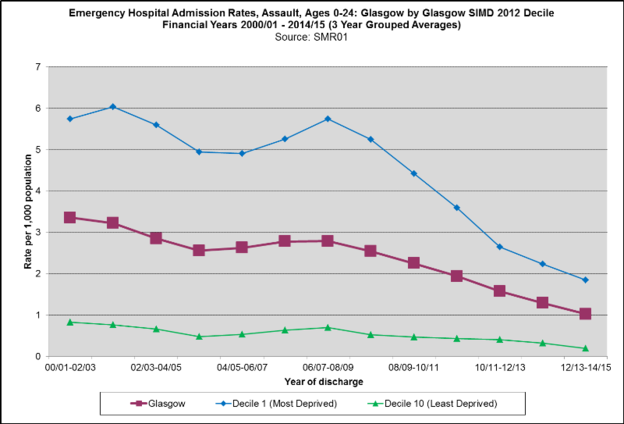
Emergency hospital admission rates, assault, ages 0-24, Glasgow SIMD 
Click on graph to expand
There are a number of trends in the emergency admission rate due to assault to note:
- The rate in the most deprived decile has improved, resulting in a relative reduction of 68% from 5.75 (2000/01-2002/03) to 1.84 (2012/2013-2014/15)
- The rate in the least deprived decile has also improved, resulting in a relative reduction of 77% from 0.82 (2000/01-2002/03) to 0.19 (2012/2013-2014/15)
- The rate in the most deprived decile has worsened marginally relative to Glasgow, increasing from 71% above the Glasgow rate during 2000/01-2002/03 to 81% above the Glasgow rate during (2012/2013-2014/15)
- The rate in the least deprived decile has improved slightly relative to Glasgow, now amounting to less than a fifth of the Glasgow rate
- The increasing rate in the most deprived decile has resulted in a widening of the gap relative to the least deprived decile, increased from a seven-fold difference during 2000/01-2002/03 to a ten-fold difference during (2012/2013-2014/15)
Notes
Scottish Morbidity Records for acute inpatient stays (SMR01) have been used here to calculate the rate of admission of persons of 24 years or less to hospital following an assault (ICD10 codes in any of six diagnostic positions X85-Y09). The data was based on discharges from completed hospital stays and have been aggregated into rolling groups of three fiscal years to produce annual averages, as annual numbers are small or liable to fluctuation.
Both Glasgow specific analyses and the analysis of Clyde Valley local authority were undertaken locally; the analysis by selected Scottish Cities has been provided by the Information Statistics Division (ISD). The figures are a subset of data from the annual ISD report Unintentional Injuries, Year Ending 31st March 2015 (published 08/03/2016): https://www.isdscotland.org/Health-Topics/Emergency-Care/Publications/2016-03-08/2016-03-08-UI-Report.pdf. Full details on data sources, methods and definitions can be found in this report.
Figures for Glasgow by Deprivation and Glasgow by Neighbourhood are provided by Information Services, NHSGG&C and are produced using the same methodology as the ISD report (there may be small differences due to using data from live systems at different times)
Additional Resources
-
ResourceThursday, 6 December 2012
Going to Gothenburg: Reflections on a Study Visit


