Overview
Poverty is a complex and dynamic phenomenon that can be defined in many different ways. However, most definitions would mention the contribution of a range of inter-related elements such as low income, unemployment, lack of opportunity, social exclusion and deprivation - both relative and absolute.
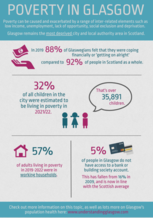
Click on our infographic to see the key facts from this indicator set.
Glasgow remains the most deprived city and local authority area in Scotland. The following summary provides some specific statistics for Glasgow:
- Almost half (44%) of Glasgow’s residents, 281,000 people, reside in the 20% of most deprived areas in Scotland. In contrast, nearly 37,000 people (6% of the population) live in the 10% of least deprived areas in Scotland (based on 2020 population estimates).
- 95% of Glaswegians have access to a bank or building society account which has risen in the last decade from 84% in 2009 and is now in line with the Scottish average.
- A lower proportion of Glaswegians are coping financially (88% in 2019) compared to Scots as a whole (92%).
- 32% of all children in the city were estimated to be living in poverty in 2021-22.
- The distribution of child poverty and vulnerability to child poverty varies dramatically across Glasgow - 70% of children in one neighbourhood experiencing poverty compared to less than 8% in the neighbourhoods with the lowest levels of child poverty.
- In 2021, 24% of children lived in workless households, 12 percentage points higher than the Scottish average
- 57% of working age adults in poverty and 69% of children in poverty live in a household where at least one person works (2019-22).
(Data from various sources:- the Scottish Household Survey, SIMD, the Annual Population Survey, the Child Poverty map of the UK, End Child Poverty and HM Revenue & Customs, Scottish Government)
Levels of poverty in Glasgow are likely to change as the full effects of Covid-19 and the cost of living crisis impact on the city.
The Scottish Government published their latest report on poverty and income inequality in Scotland in March 2023, covering the period of April 2019- March 2022. This report was not updated in 2022 due to issues with collecting good quality data during the Covid-19 pandemic. The key findings in the 2023 report were:
- 21% of people in Scotland were living in relative poverty, after accounting for housing costs
- these figures had been dropping between 1994-97 and 2021-2015, but had risen slightly since then and the 2019-22 estimate was 2 percentage points higher than that of 2018-21
- splitting by population age group, 24% of children, 21% of working age people, and 15% of pensioners were living in relative poverty, after accounting for housing costs
- 35% of those living in relative poverty, and 45% of children living in relative poverty, in Scotland were experiencing food insecurity
- poverty rates were higher for various population groups, including: disabled people, young adults (age 16-24), people from non-white ethnic minorities, Muslims, single mothers, single men, and people who were single, divorced or separated.
In this section a range of summary indicators are used to illustrate poverty in Glasgow, including access to a bank account, child poverty, and relative deprivation. The children's indicators section of Understanding Glasgow contains more detailed information on child poverty within Glasgow.
Links to a selection of recent reports relating to poverty are available on the poverty resources page.
The data on the Understanding Glasgow website comes from a variety of administrative sources and surveys, and the frequency of updates to these sources varies. The graphs and text on each page should indicate the period to which an indicator refers. In some cases, where more recently published data is not available, we still use older published sources, such as the 2011 Census. Find out more about the timeliness of data presented on this website.
This page was last updated in June 2023.
Additional Resources
-
ResourceWednesday, 2 June 2010
SIMD Analysis: Future Projections
An analysis of the reasons behind the recent decline of deprivation in Glasgow, with tend projections towards 2015. -
ResourceSunday, 1 November 2009
Miniature Glasgow - Video
An extension of the GCPH's work profiling Glasgow's health, produced in collaboration with the International Future Forum.


