North West Sector
North West Sector
Kelvindale and Kelvinside
Maryhill Road Corridor
North Maryhill and Summerston
Ruchill and Possilpark
Lambhill and Milton
City Centre and Merchant City
Yorkhill and Anderston
Hillhead and Woodlands
Hyndland, Dowanhill and Partick East
Broomhill and Partick West
Anniesland, Jordanhill and Whiteinch
Yoker and Scotstoun
Knightswood
Blairdardie
Drumchapel
Temple and Anniesland
*Please note that this profile is based on data from the 2022 Census.*
Download a printer friendly version of Glasgow North West here
The Glasgow North West sector has a population of 234,296.

Sector comparisons with Scotland
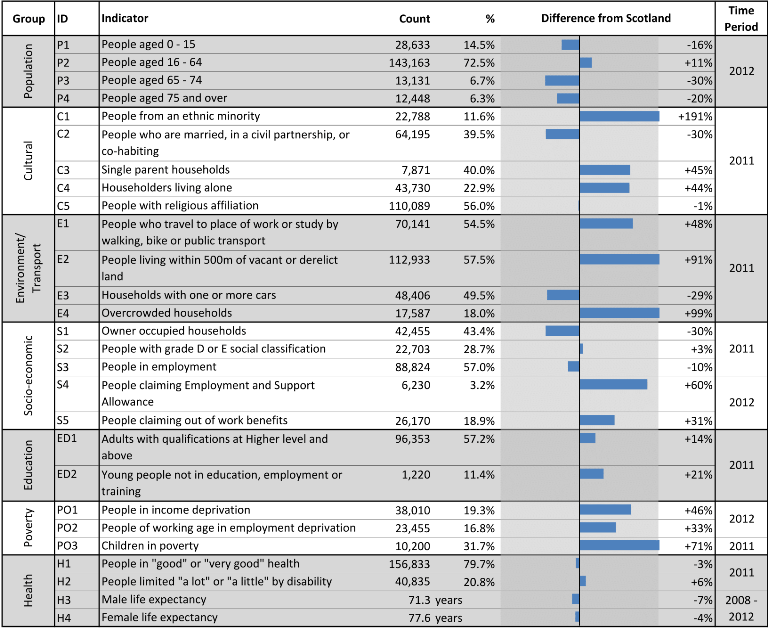
Women in Glasgow North West live, on average, five years longer than men. In this sector 21% of the population is from a minority ethnic background which is considerably higher than the Scottish average. Socially-rented households make up 33% of all households. There are 30% of people who travel to work by walking, bike, or public transport, which is 75% higher than the Scottish average. In this area 23% of children are living in poverty and 24% of people are limited “a lot” or “a little” by disability.
 Sector trends

Life expectancy, since early 2001, has steadily increased for both males and females. From 2015 onward, year-on-year variations reduced, and recent data show only small fluctuations in Glasgow North West. Life expectancy is above the Glasgow average but below the Scottish average.

The overall population of Glasgow North West increased between 2001 and 2024. There are fluctuations throughout, however, there has been a higher increase in the population aged between 16-64. The percentage of the total population from a minority ethnic background increased from 5.3% in 2001 to 20.9% in 2022, this was above the Scottish average.
Notes
An Excel workbook containing the data used in all of the profiles can be downloaded here. This workbook also includes alternative output formats and further breakdowns of some of the variables.
- Data sources: Scottish Index of Multiple Deprivation (SIMD) 2020, Census 2022, 2011, and 2001, National Records of Scotland (NRS).
- Populations presented in the population trend chart and used to calculate life expectancy estimates are taken from NRS small area population estimates and are based on: the 2001 and 2011 Census for years 2001-2010; and the 2011 and 2022 Census for years 2011-2024.
- This publication has used small area population estimate data published by the NRS on 24 February 2026. The NRS update their small area population estimates and previous estimates on an annual basis therefore this data is only representative of the data published upon this date. For further information see: https://www.nrscotland.gov.uk/publications/small-area-population-estimates-mid-2023-and-mid-2024-2011-data-zones/
- The Income deprivation and Employment deprivation indicators are derived from SIMD 2020, more information on this deprivation index can be found at: https://www.gov.scot/collections/scottish-index-of-multiple-deprivation-2020/.
- Life expectancies are calculated based on population estimates and death registrations. 95% confidence intervals have been added on the graphs to the neighbourhood data to give an indication of their accuracy. The 95% confidence interval for the Glasgow and/or Scotland comparison line has been removed due to the size of the population. This resulted in the confidence interval sitting on the data line making it unreadable. The x-axes of the life expectancy graphs give the mid-year for each life expectancy estimate e.g. 2020 represents the life expectancy estimate for the period 2018-2022.
- A notes and definitions document providing further information on the variables presented in the profile can be found in the Profiles section of the Understanding Glasgow website: https://www.understandingglasgow.com/profiles/neighbourhood-profiles.