Trends
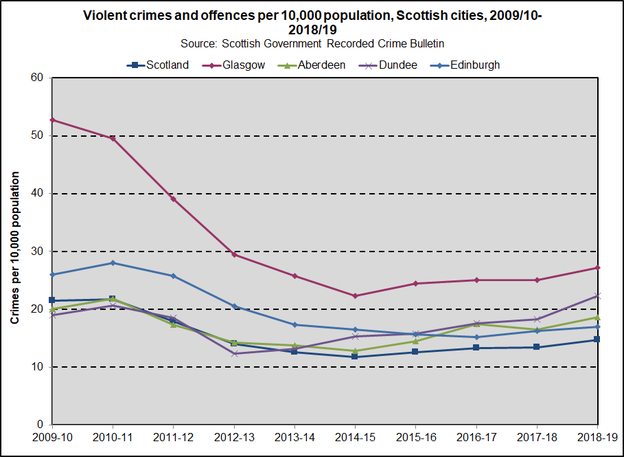
Trend in violent crimes and offences, Scottish cities, 2007/08 - 2018/19
Click on graph to expand
The chart above illustrates the trend of recorded violent crimes and offences from 2009/10 to 2018/19. From 2009/10 to 2014/15, the rate of violent crimes in Glasgow declined by 58%. The overall rate for Scotland also declined by 45% during this period. Between 2014/15 and the most recent period (2018/19), however, the rates of violent crimes per 10,000 population have increased in Scotland and all the Scottish cities.
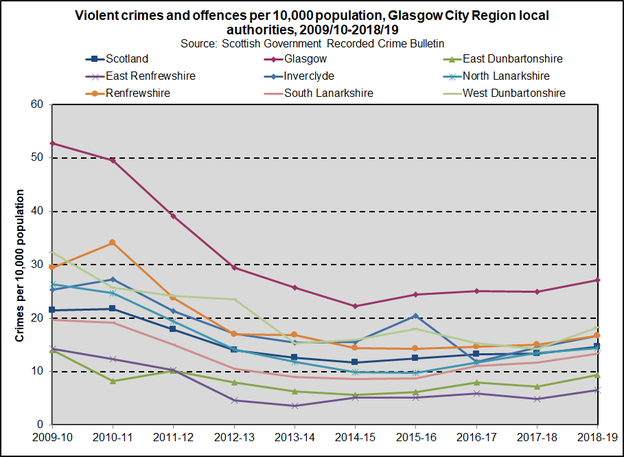
Trend in violent crimes and offences, Glasgow and Clyde Valley local authorities, 2007/08 - 2018/19
Click on graph to expand
The chart above illustrates the trend of recorded violent crimes and offences from 2009/10 to 2018/19. From 2009/10 to 2014/15, the rate of violent crimes in Glasgow declined by 58%. The overall rate for Scotland also declined by 45% during this period. Between 2014/15 and the most recent period (2018/19), however, the rates of violent crimes per 10,000 population have increased in Scotland and most of the Glasgow city region local authorities.
Notes
This measure of violent crimes and offences includes recorded non-sexual crimes and offences of violence, such as murder, attempted murder, serious assault, common assault, and robbery.
Additional Resources
-
ResourceFriday, 23 July 2010
Community Safety Strategic Assessment
A strategic overview of community safety issues and priorities for Glasgow 2010/11 -
ResourceThursday, 6 September 2007
ACPOS Public Reassurance Strategy
Issued by the Association of Chief Police Officers in Scotland


