UK Cities
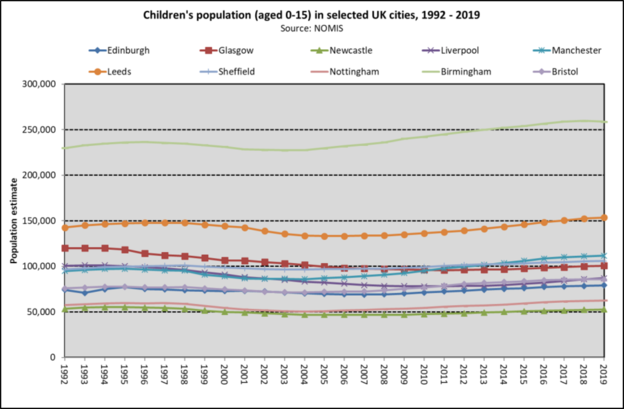
Child population in selected UK cities, 1992-2019 Click on graph to enlarge
Over the last twenty seven years, the child population of the selected UK cities has fluctuated. In the last 8 years there have been increases in the child populations of all the cities.
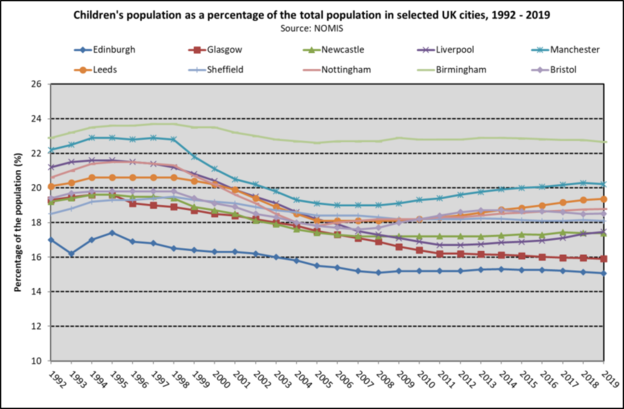
Children's population as a proportion of the total population, selected UK cities, 1992-2019 Click on graph to enlarge
The percentage of children within each of city's total population has reduced over the last 27 years in the majority of UK cities shown; with Birmingham being the exception to this where there has been no net change in the proportion of children in the population. In the last few years the proportion of children in the population has increased in the majority of these cities, but Glasgow and Edinburgh are exceptions to this trend.


